
Page 144 - AIH-1-2
P. 144
Artificial Intelligence in Health Movement detection with sensors and AI
Table 2. Comparisons of accuracy, AUC, recall, precision, F1 score, Kappa, and MCC for different machine learning classifier
models
Model Accuracy AUC Recall Precision F1 Kappa MCC TT (s)
LIGHTLGBM - Light Gradient Boosting Machine 0.8937* 0.9830 0.8937* 0.9017* 0.8926* 0.8723* 0.8744* 3.0400
ET - Extra Trees Classifier 0.8912 0.9856* 0.8912 0.8976 0.8899 0.8693 0.8710 0.2650
XGBOOST - Extreme Gradient Boosting 0.8765 0.9821 0.8765 0.8859 0.8742 0.8517 0.8544 2.0500
RF - Random Forest Classifier 0.8763 0.9853 0.8763 0.8875 0.8737 0.8514 0.8545 0.7430
GBC - Gradient Boosting Classifier 0.8738 0.9799 0.8738 0.8882 0.8717 0.8485 0.8522 13.181
DT - Decision Tree Classifier 0.8273 0.8969 0.8273 0.8493 0.8271 0.7927 0.7974 0.0750
KNN - K Neighbors Classifier 0.7946 0.9456 0.7946 0.8236 0.7943 0.7534 0.7602 0.0570
NB - Naive Bayes 0.7773 0.9589 0.7773 0.7919 0.7739 0.7331 0.7373 0.0480
LDA - Linear Discriminant Analysis 0.7701 0.9248 0.7701 0.7890 0.7690 0.7239 0.7282 0.1420
LR - Logistic Regression 0.7182 0.8895 0.7182 0.7932 0.7175 0.6613 0.6735 1.4500
SVM - SVM – Linear Kernel 0.6270 0.0000 0.6270 0.6821 0.5873 0.5511 0.5844 0.1190
RIDGE - Ridge Classifier 0.5676 0.0000 0.5676 0.6386 0.5372 0.4803 0.5079 0.0910
ADA - Ada Boost Classifier 0.5136 0.7910 0.5136 0.4010 0.4147 0.4120 0.5165 0.5200
QDA - Quadratic Discriminant Analysis 0.3955 0.6350 0.3955 0.5045 0.3514 0.2706 0.3064 0.1170
DUMMY - Dummy Classifier 0.1729 0.5000 0.1729 0.0299 0.0510 0.0000 0.0000 0.0420
Note: *Highest value.
Abbreviations: AUC: Area under the curve; MCC: Matthews correlation coefficient; TT: Training time.
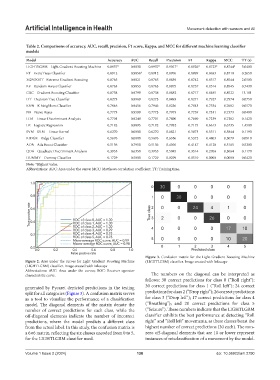
Figure 3. Confusion matrix for the Light Gradient Boosting Machine
Figure 2. Area under the curves for Light Gradient Boosting Machine (LIGHTLGBM) classifier. Image created with Inkscape
(LIGHTLGBM) classifier. Image created with Inkscape
Abbreviations: AUC: Area under the curves; ROC: Receiver operator
characteristic curve. The numbers on the diagonal can be interpreted as
follows: 30 correct predictions for class 0 (“Roll right”);
generated by Pycaret depicted predictions in the testing 30 correct predictions for class 1 (“Roll left”); 24 correct
split for all categories (Figure 3). A confusion matrix serves predictions for class 2 (“Drop right”); 26 correct predictions
as a tool to visualize the performance of a classification for class 3 (“Drop left”); 17 correct predictions for class 4
model. The diagonal elements of the matrix denote the (“Breathing”); and 20 correct predictions for class 5
number of correct predictions for each class, while the (“Seizure”). These numbers indicate that the LIGHTLGBM
off-diagonal elements indicate the number of incorrect classifier exhibits the best performance at detecting “Roll
predictions, where the model predicts a different class right” and “Roll left” movements, as these classes boast the
from the actual label. In this study, the confusion matrix is highest number of correct predictions (30 each). The non-
a 6×6 matrix, reflecting the six classes encoded from 0 to 5, zero off-diagonal elements that are 10 or lower represent
for the LIGHTLGBM classifier used. instances of misclassification of a movement by the model.
Volume 1 Issue 2 (2024) 138 doi: 10.36922/aih.2790