
Page 31 - {PDF Title}
P. 31
MSW management in Jamshedpur: Challenges & solutions
categories based on their physical composition: paper,
plastics, glass, leather, wood, metal, thermocol, textiles,
and organic fractions. They meticulously sorted and
measured the organic fraction of vegetable peels, food
waste, and garden debris to determine its percentage in
the overall sample. They also classified and quantified
the non-biodegradable components.
To enhance the data collected, we conducted interviews
with 120 citizens, among them 60 individuals were from
the residential zone while the remaining 60 were from
the commercial zone, which is the major contributor to
MSW in Jamshedpur. We conducted direct inquiries with
10 staff members of TSUISL and field visits to collect
data on the generation, handling, and disposal of MSW.
We obtained secondary data by consulting with municipal
authorities, specifically by TSUISL, and reviewing
relevant online sources. This extensive approach allowed
for a detailed examination of Jamshedpur’s MSW
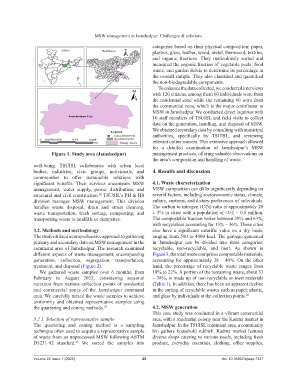
Figure 1. Study area (Jamshedpur) management practices, offering valuable observations on
the area’s composition and handling of waste.
well-being. TSUISL collaborates with urban local
bodies, industries, civic groups, individuals, and 4. Results and discussion
communities to offer sustainable solutions with
significant benefits. Their services encompass MSW 4.1. Waste characterization
management, water supply, power distribution, and MSW composition can differ significantly depending on
structural and civil construction. TSUSIL’s PH & HS several factors, including socioeconomic status, climate,
26
division manages MSW management. This division culture, customs, and dietary preferences of individuals.
handles waste disposal, drain and street cleaning, The carbon to nitrogen (C/N) ratio is approximately 26
waste transportation, trash sorting, composting, and ± 5% in cities with a population of <0.1 – 0.5 million.
transporting waste to landfills or dumpsites. The compostable fraction varies between 29% and 63%,
with recyclables accounting for 13% – 36%. These cities
3.2. Methods and methodology also have a significant calorific value on a dry basis,
The study utilized a comprehensive approach to gathering ranging from 590 to 4000 kcal. The garbage generated
primary and secondary data on MSW management in the in Jamshedpur can be divided into three categories:
command area of Jamshedpur. The research examined recyclable, non-recyclable, and inert. As shown in
different aspects of waste management, encompassing Figure 3, the total waste comprises compostable materials,
generation, collection, segregation, transportation, accounting for approximately 38 – 40%. On the other
treatment, and disposal (Figure 2). hand, the percentage of recyclable waste ranges from
We gathered waste samples over 6 months, from 18% to 22%. A portion of the remaining waste, about 33
February to August 2023, considering seasonal – 38%, is made up of non-recyclable or inert materials
variation from various collection points of residential (Table 1). In addition, there has been an apparent decline
and commercial zones of the Jamshedpur command in the sorting of recyclable wastes such as paper, plastic,
area. We carefully mixed the waste samples to achieve and glass by individuals at the collection points. 28
uniformity and obtained representative samples using
the quartering and coning methods. 27 4.2. MSW generation
This case study was conducted in a vibrant commercial
3.2.1. Selection of representative sample area, with a residential colony near the Kadma market in
The quartering and coning method is a sampling Jamshedpur. In the TSUISL command area, a community
technique often used to acquire a representative sample bin gathers household rubbish. Kadma market features
of waste from an unprocessed MSW following ASTM diverse shops catering to various needs, including fresh
D5231-92 standard. We sorted the samples into produce, everyday essentials, clothing, office supplies,
27
Volume 22 Issue 1 (2025) 25 doi: 10.36922/ajwep.7337