
Page 121 - AN-4-2
P. 121
Advanced Neurology ML for EEG signal recognition
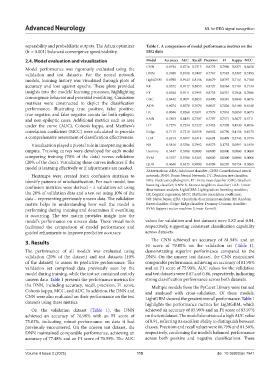
separability and probabilistic outputs. The Adam optimizer Table 1. A comparison of model performance metrics on the
(lr = 0.001) balanced convergence speed/stability. EEG data
2.4. Model evaluation and visualization Model Accuracy AUC Recall Precision F1 Kappa MCC
Model performance was rigorously evaluated using the CNN 0.8194 0.8716 0.7315 0.8778 0.7980 0.6371 0.6458
validation and test datasets. For the neural network DNN 0.7698 0.8190 0.7407 0.7767 0.7583 0.5387 0.5393
models, training history was visualized through plots of LightGBM 0.8590 0.9143 0.8156 0.8679 0.8397 0.7141 0.7168
accuracy and loss against epochs. These plots provided RF 0.8572 0.9117 0.8055 0.8727 0.8364 0.7101 0.7134
insights into the models’ learning processes, highlighting ET 0.8544 0.9111 0.7995 0.8733 0.8331 0.7044 0.7086
convergence behavior and potential overfitting. Confusion GBC 0.8442 0.9071 0.8055 0.8480 0.8245 0.6846 0.6876
matrices were constructed to depict the classification ADA 0.8074 0.8570 0.7670 0.8047 0.7826 0.6100 0.6140
performance, illustrating true positive, false positive,
true negative, and false negative counts for both epileptic LR 0.8046 0.8260 0.7691 0.7979 0.7816 0.6050 0.6073
and non-epileptic cases. Additional metrics such as area KNN 0.7853 0.8435 0.7307 0.7797 0.7571 0.5677 0.5711
under the curve (AUC), Cohen’s kappa, and Matthew’s DT 0.7271 0.7254 0.7227 0.7452 0.7338 0.4520 0.4556
correlation coefficient (MCC) were calculated to provide Ridge 0.7115 0.7218 0.6558 0.6942 0.6730 0.4156 0.4173
a comprehensive assessment of classification effectiveness. LDA 0.6913 0.6957 0.6314 0.6691 0.6499 0.3743 0.3754
Visualization played a pivotal role in interpreting model NB 0.5816 0.5786 0.7992 0.8573 0.1732 0.0391 0.1859
outputs. Training curves were developed for each model Dummy 0.5447 0.5700 0.0000 0.0000 0.0000 0.0000 0.0000
comparing training (70% of the data) versus validation SVM 0.5107 0.5700 0.5285 0.0000 0.0000 0.0000 0.0000
(20% of the data). Visualizing these curves indicates if the QDA 0.4646 0.6525 0.9980 0.4599 0.6295 0.0154 0.0263
model is learning effectively or if adjustments are needed.
Abbreviations: ADA: Ada boost classifier; CNN: Convolutional neural
Heatmaps were created from confusion matrices to network; DNN: Dense Neural Network; DT: Decision tree classifier;
identify patterns of misclassification. For each model, two EEG: Electroencephalogram; ET: Extra trees classifier; GBC: Gradient
confusion matrices were derived – a validation set using boosting classifier; KNN: K-Nearest neighbors classifier; LDA: Linear
discriminant analysis; LightGBM: Light gradient boosting machine;
the 20% of validation data and a test set using 10% of the LR: Logistic regression; MCC: Matthews correlation coefficient;
data – representing previously unseen data. The validation NB: Naive Bayes; QDA: Quadratic discriminant analysis; RF: Random
matrix helps in understanding how well the model is forest classifier; Ridge: Ridge classifier: Dummy: Dummy classifier;
performing during training and determines if overfitting SVM: Support vector machine (Linear Kernel).
is occurring. The test matrix provides insight into the
model’s performance on unseen data. These visual tools values for validation and test datasets were 0.82 and 0.84,
facilitated the comparison of model performance and respectively, suggesting consistent classification capability
guided refinements to improve predictive accuracy. across datasets.
The CNN achieved an accuracy of 81.94% and an
3. Results F1 score of 79.80% on the validation set (Table 1),
The performance of all models was evaluated using demonstrating superior performance compared to the
validation (20% of the dataset) and test datasets (10% DNN. On the unseen test dataset, the CNN maintained
of the dataset) to assess its predictive performance. The comparable performance, achieving an accuracy of 81.98%
validation set comprised data previously seen by the and an F1 score of 75.90%. AUC values for the validation
model during training, while the test set contained entirely and test datasets were 0.87 and 0.86, respectively, indicating
unseen data. Table 1 presents the performance metrics for strong classification performance across both datasets.
the DNN, including accuracy, recall, precision, F1 score, Multiple models from the PyCaret Library were trained
Cohen’s kappa, MCC, and AUC. In addition, the DNN and and analyzed with cross-validation. Of these models,
CNN were also evaluated on their performance on the test LightGBM showed the greatest overall performance. Table 1
datasets using these metrics. highlights the performance metrics for LightGBM, which
On the validation dataset (Table 1), the DNN achieved an accuracy of 85.90% and an F1 score of 83.97%
achieved an accuracy of 76.98% with an F1 score of on the test dataset. The model also attained a high AUC value
75.83%, indicating robust performance on data it had of 0.91, reflecting its excellent ability to distinguish between
previously encountered. On the unseen test dataset, the classes. Precision and recall values were 86.79% and 81.56%,
DNN maintained comparable performance, achieving an respectively, confirming the model’s balanced performance
accuracy of 77.48% and an F1 score of 70.59%. The AUC across both positive and negative classifications. These
Volume 4 Issue 2 (2025) 115 doi: 10.36922/an.7941