
Page 76 - AN-4-4
P. 76
Advanced Neurology PSG findings in young poor sleepers
(TST), representing the total duration of actual sleep protocol. Table 1 presents the demographic characteristics
excluding wake periods; SE, representing the percentage and PSQI scores of the study participants.
of time in bed spent asleep; sleep onset latency (SOL), the The study sample consisted of young adults with
time from lights out to the first epoch of sleep; REM onset a mean age of 25.33 ± 2.23 years, representing a good
latency (ROL), the time from sleep onset to first REM sleep distribution across the target age range of 18–29 years.
epoch; WK, the percentage of TST spent awake after sleep Participants had a mean height of 1.61 ± 0.05 m and
onset; N1 sleep stage, the percentage of TST in light sleep; weight of 60.70 ± 4.21 kg, resulting in a mean body mass
N2 sleep stage, the percentage of TST in stable non-REM index of 23.32 ± 1.64 kg/m , which falls within the normal
2
sleep; N3 sleep stage, the percentage of TST in deep sleep; range according to the World Health Organization
and REM sleep, the percentage of TST in REM sleep. classifications. All participants demonstrated poor
2.6. Statistical analysis subjective sleep quality, with a mean PSQI global score
of 12.70 ± 3.19, well above the cutoff of 5 used to define
2.6.1. Data management and preparation poor sleep quality.
Statistical analysis was conducted using IBM Statistical
Package for the Social Sciences Statistics 26.0 (Chicago, IL, 3.2. Polysomnographic findings
USA). Before analysis, all data underwent comprehensive The comprehensive polysomnographic analysis revealed
quality checking procedures, including range validation, significant differences across all measured sleep parameters
missing data assessment, and outlier identification. when compared to established normative values for healthy
Descriptive statistics were calculated for all variables. young adult males. Table 2 and Figure 1 present detailed
results of the comparative analysis.
2.6.2. Normality assessment and assumptions testing
Data distribution normality was assessed using the Shapiro- 3.2.1. Sleep continuity measures
Wilk test, complemented by visual inspection of histograms TST was significantly shorter among participants with
and Q-Q plots. Given the relatively small sample size, non- poor subjective sleep quality compared to normative values
parametric alternatives were considered where appropriate. (363.65 ± 33.10 min vs. 404.10 ± 45.20 min; t = −7.04,
Levene’s test was utilized to assess the homogeneity of p<0.001). The mean difference of −40.45 min represents a
variance assumptions for parametric testing. clinically meaningful reduction in sleep duration, with a
large effect size (Cohen’s d = 1.23).
2.6.3. Primary statistical analyses
SE was paradoxically higher in participants
Comparative analysis was performed using independent demonstrated compared to normative values (89.70 ± 1.55%
samples t-tests to compare each polysomnographic vs. 84.40 ± 9.30%; t = 19.50, p<0.001). This counterintuitive
parameter between the study sample and established finding, with a mean difference of +5.27%, suggests that
normative values. Normative data were obtained from despite shorter TST, participants spent a higher proportion
Hertenstein et al., which provide comprehensive of their time in bed actually sleeping.
16
polysomnographic reference values for healthy adults, with
specific normative values extracted for the young adult male 3.2.2. Sleep onset characteristics
(ages 19–30 years) to ensure appropriate age and gender For SOL, participants required significantly longer time to
matching. Effect size calculations were calculated using fall asleep compared to normative values (27.60 ± 6.50 min
Cohen’s d effect sizes to assess the practical significance vs. 22.20 ± 13.70 min; t = 4.75, p<0.001). The mean
of observed differences, with effect sizes interpreted using
established conventions: small (d = 0.2), medium (d = 0.5),
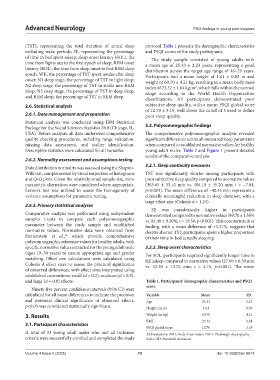
and large (d = 0.8) effects. Table 1. Participants’ demographic characteristics and PSQI
score
Ninety-five percent confidence intervals (95% CI) were
calculated for all mean differences to indicate the precision Variable Mean SD
and potential clinical significance of observed effects. Age 25.33 2.23
p<0.05 was considered statistically significant. Height (in m) 1.61 0.05
3. Results Weight (in kg) 60.70 4.21
BMI 23.32 1.64
3.1. Participant characteristics
PSQI global score 12.70 3.19
A total of 33 young adult males who met all inclusion Abbreviations: BMI: Body mass index; PSOI: Pittsburgh sleep quality
criteria were successfully enrolled and completed the study index; SD: Standard deviation.
Volume 4 Issue 4 (2025) 70 doi: 10.36922/an.8614