
Page 153 - EJMO-9-2
P. 153
Eurasian Journal of
Medicine and Oncology Subdural catheter guidance for CSDH
A B C
D E F
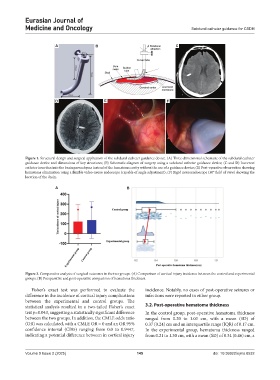
Figure 1. Structural design and surgical application of the subdural catheter guidance device. (A) Three-dimensional schematic of the subdural catheter
guidance device and dimensions of key structures; (B) Schematic diagram of surgery using a subdural catheter guidance device; (C and D) Incorrect
catheter insertion into the brain parenchyma instead of the hematoma cavity without the use of a guidance device; (E) Post-operative observation showing
hematoma elimination using a flexible video-neuro endoscope (capable of angle adjustment); (F) Rigid neuroendoscope (30° field of view) showing the
location of the drain.
A B
Figure 2. Comparative analysis of surgical outcomes in the two groups. (A) Comparison of cortical injury incidence between the control and experimental
groups. (B) Preoperative and post-operative comparison of hematoma thickness.
Fisher’s exact test was performed to evaluate the incidence. Notably, no cases of post-operative seizures or
difference in the incidence of cortical injury complications infections were reported in either group.
between the experimental and control groups. The
statistical analysis resulted in a two-tailed Fisher’s exact 3.2. Post-operative hematoma thickness
test p=0.043, suggesting a statistically significant difference In the control group, post-operative hematoma thickness
between the two groups. In addition, the CMLE odds ratio ranged from 0.20 to 1.03 cm, with a mean (SD) of
(OR) was calculated, with a CMLE OR = 0 and an OR 95% 0.37 (0.24) cm and an interquartile range (IQR) of 0.17 cm.
confidence interval (CI95) ranging from 0.0 to 0.9447, In the experimental group, hematoma thickness ranged
indicating a potential difference between in cortical injury from 0.21 to 1.30 cm, with a mean (SD) of 0.34 (0.46) cm, a
Volume 9 Issue 2 (2025) 145 doi: 10.36922/ejmo.8532