
Page 187 - GHES-2-4
P. 187
Global Health Economics and
Sustainability
Evaluation of mental health law in Chile
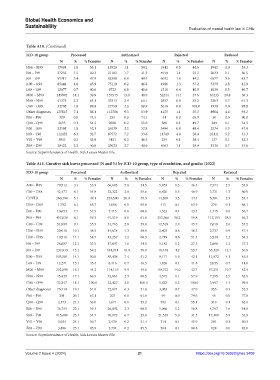
Table A10. (Continued)
ICD‑10 group Processed Authorized Rejected Reduced
N % % Females N % % Females N % % Females N % % Females
H60 – H95 17804 1.0 53.1 13920 1.1 54.2 1942 0.5 44.6 1942 1.0 53.3
I00 – I99 27233 1.5 30.3 21182 1.7 31.3 4018 1.1 25.2 2033 1.1 30.5
J00 – J99 95317 5.4 47.9 82308 6.8 48.5 6032 1.6 44.2 6977 3.6 43.7
K00 – K93 85444 4.8 45.9 75119 6.2 46.8 4986 1.3 37.2 5339 2.8 41.9
L00 – L99 12077 0.7 40.6 9722 0.8 40.6 1316 0.4 40.5 1039 0.5 40.7
M00 – M99 249992 14.1 39.8 157515 13.0 40.9 52244 14.1 37.6 40233 20.8 38.3
N00 – N99 41373 2.3 63.1 35313 2.9 64.1 2857 0.8 53.2 3203 1.7 61.3
O00 – O99 32708 1.8 99.9 27759 2.3 99.9 3019 0.8 100.0 1930 1.0 99.8
Other diagnoses 125815 7.1 56.1 112786 9.3 53.9 4125 1.1 35.3 8904 4.6 93.2
P00 – P96 329 0.0 74.5 255 0.0 74.1 44 0.0 65.9 30 0.0 90.0
Q00 – Q99 2635 0.1 54.2 2038 0.2 55.0 388 0.1 49.7 209 0.1 54.5
R00 – R99 32598 1.8 52.1 26530 2.2 52.8 3494 0.9 49.4 2574 1.3 47.9
S00 – T98 112432 6.3 32.7 87572 7.2 33.6 14749 4.0 28.4 10111 5.2 31.3
V01 – Y98 3843 0.2 45.8 3451 0.3 46.5 255 0.1 38.4 137 0.1 42.3
Z00 – Z99 38422 2.2 40.0 33023 2.7 40.0 4063 1.1 38.9 1336 0.7 43.6
Source: Superintendence of Health, Sick Leaves Master File.
Table A11. Curative sick leaves processed (N and %) by ICD‑10 group, type of resolution, and gender (2022)
ICD‑10 group Processed Authorized Rejected Reduced
N % % Females N % % Females N % % Females N % % Females
A00 – B99 79,512 3.1 53.9 66,683 5.8 54.5 5,455 1.3 46.3 7,374 2.5 53.8
C00 – D48 42,473 4.1 54.8 32,322 2.8 55.6 6,420 1.5 46.9 3,731 1.3 60.9
COVID 260,490 5.1 49.1 239,500 20.9 49.3 14,209 3.3 44.4 6,781 2.3 53.4
D50 – D89 1,792 6.1 65.7 1,098 0.1 65.8 415 0.1 63.9 279 0.1 68.1
E00 – E90 10,653 7.1 57.5 7,415 0.6 60.6 1,523 0.4 43.4 1,715 0.6 56.7
F00 – F99 457,038 8.1 59.3 91,519 8.0 61.8 253,366 58.2 59.8 112,153 38.5 56.3
G00 – G99 51,899 9.1 55.5 31,763 2.8 59.8 12,518 2.9 45.7 7,618 2.6 53.5
H00 – H59 20,018 10.1 48.5 14,878 1.3 50.0 2,403 0.6 40.3 2,737 0.9 47.4
H60 – H95 19,516 11.1 58.7 13,257 1.2 60.3 2,719 0.6 51.4 3,540 1.2 58.3
I00 – I99 26,687 12.1 33.5 17,897 1.6 34.5 5,182 1.2 27.5 3,608 1.2 37.3
J00 – J99 237,813 13.1 58.2 184,244 16.0 58.8 18,440 4.2 55.7 35,129 12.1 56.8
K00 – K93 105,581 14.1 50.0 85,438 7.4 51.2 8,171 1.9 42.1 11,972 4.1 46.5
L00 – L99 12,271 15.1 45.4 8,416 0.7 46.5 1,820 0.4 41.8 2,035 0.7 44.0
M00 – M99 232,099 16.1 44.2 114,116 9.9 45.6 60,732 14.0 42.7 57,251 19.7 42.9
N00 – N99 45,829 17.1 66.5 33,861 2.9 68.5 4,573 1.1 57.9 7,395 2.5 62.9
O00 – O99 32,247 18.1 100.0 22,427 2.0 100.0 5,823 1.3 100.0 3,997 1.4 99.9
Other diagnoses 76,710 19.1 51.6 72,674 6.3 51.8 3,083 0.7 47.0 953 0.3 52.3
P00 – P96 301 20.1 67.1 207 0.0 61.8 49 0.0 79.6 45 0.0 77.8
Q00 – Q99 2,573 21.1 56.0 1,671 0.1 55.2 592 0.1 55.1 310 0.1 62.6
R00 – R99 36,755 22.1 59.3 26,892 2.3 60.5 5,066 1.2 56.8 4,797 1.6 54.8
S00 – T98 115,680 23.1 34.7 76,972 6.7 35.8 21,539 5.0 31.5 17,169 5.9 33.8
V01 – Y98 3,034 24.1 50.7 2,439 0.2 51.4 314 0.1 45.9 281 0.1 50.5
Z00 – Z99 3,486 25.1 85.9 2,794 0.2 85.5 564 0.1 88.8 128 0.0 82.0
Source: Superintendence of Health, Sick Leaves Master File.
Volume 2 Issue 4 (2024) 21 https://doi.org/10.36922/ghes.3408