
Page 87 - GTM-3-2
P. 87
Global Translational Medicine Neuropathic pain after 23-gauge sclerotomy
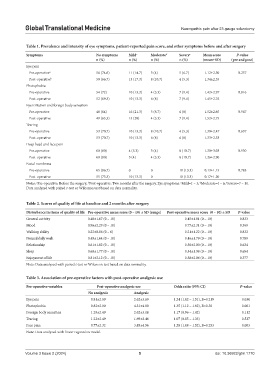
Table 1. Prevalence and intensity of eye symptoms, patient‑reported pain score, and other symptoms before and after surgery
Symptoms No symptoms Mild Moderate d Severe e Mean score P‑value
c
n (%) n (%) n (%) n (%) (mean±SD) (pre and post)
Eye pain
Pre-operative a 56 (74.6) 11 (14.7) 3 (4) 5 (6.7) 1.12±2.50 0.257
Post-operative b 50 (66.7) 13 (17.3) 8 (10.7) 4 (5.3) 1.34±2.55
Photophobia
Pre-operative 54 (72) 10 (13.3) 4 (5.3) 7 (9.4) 1.42±2.97 0.816
Post-operative 52 (69.3) 10 (13.3) 6 (8) 7 (9.4) 1.45±2.76
Eye irritation and foreign body sensation
Pre-operative 48 (64) 16 (21.3) 5 (6.7) 6 (8) 1.52±2.65 0.967
Post-operative 49 (65.3) 15 (20) 4 (5.3) 7 (9.4) 1.52±2.75
Tearing
Pre-operative 53 (70.7) 10 (13.3) 8 (10.7) 4 (5.3) 1.30±2.47 0.637
Post-operative 53 (70.7) 10 (13.3) 6 (8) 6 (8) 1.33±2.53
Deep head and face pain
Pre-operative 60 (80) 4 (5.3) 3 (4) 8 (10.7) 1.30±3.03 0.930
Post-operative 60 (80) 3 (4) 4 (5.3) 8 (10.7) 1.26±2.90
Facial numbness
Pre-operative 65 (86.7) 0 0 10 (13.3) 0.13±1.15 0.785
Post-operative 55 (73.3) 10 (13.3) 0 10 (13.3) 0.17±1.20
Notes: Pre-operative: Before the surgery; Post-operative: Two months after the surgery. Eye symptoms: Mild=1 – 3; Moderate=4 – 6; Severe=7 – 10.
e
b
d
a
c
Data analyzed with paired t-test or Wilcoxon test based on data normality.
Table 2. Scores of quality of life at baseline and 2 months after surgery
Disturbance in items of quality of life Pre‑operative mean score (0 – 10) ± SD (range) Post‑operative mean score (0 – 10) ± SD P‑value
General activity 0.48±1.67 (0 – 10) 0.45±1.81 (0 – 10) 0.833
Mood 0.96±2.29 (0 – 10) 0.77±2.31 (0 – 10) 0.369
Walking ability 0.22±0.86 (0 – 6) 0.21±1.22 (0 – 10) 0.832
Normal daily work 0.49±1.64 (0 – 10) 0.46±1.79 (0 – 10) 0.789
Relationship 0.61±1.82 (0 – 10) 0.50±2.00 (0 – 10) 0.634
Sleep 0.60±1.77 (0 – 10) 0.54±1.98 (0 – 10) 0.654
Enjoyment of life 0.81±2.12 (0 – 10) 0.58±2.06 (0 – 10) 0.377
Note: Data analyzed with paired t-test or Wilcoxon test based on data normality.
Table 3. Association of pre‑operative factors with post‑operative analgesic use
Pre‑operative variables Post‑operative analgesic use Odds ratio (95% CI) P‑value
No analgesic Analgesic
Eye pain 0.81±2.09 2.62±3.69 1.24 (1.02 – 1.51), B=0.219 0.030
Photophobia 0.82±2.00 4.31±4.80 1.35 (1.12 – 1.62), B=0.30 0.001
Foreign body sensation 1.29±2.49 2.62±3.18 1.17 (0.96 – 1.42) 0.112
Tearing 1.23±2.49 1.69±2.46 1.07 (0.85 – 1.33) 0.537
Face pain 0.77±2.32 3.85±4.56 1.28 (1.08 – 1.52), B=0.253 0.003
Note: Data analyzed with linear regression model.
Volume 3 Issue 2 (2024) 5 doi: 10.36922/gtm.1770