
Page 219 - IJB-10-2
P. 219
International Journal of Bioprinting Property of scaffolds with different lattices
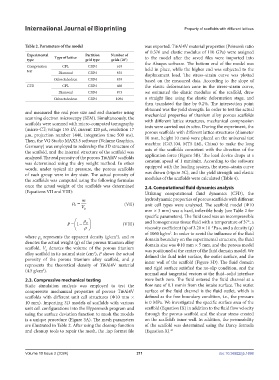
Table 2. Parameters of the model was exported. Ti6Al4V material properties (Poisson’s ratio
of 0.376 and elastic modulus of 110 GPa) were assigned
Experimental Type of lattice Partition Number of
type grid type grids (10 ) to the model after the saved files were imported into
4
Compression CPL C3D4 619 the Abaqus software. The bottom end of the model was
held in place, while the higher end was subjected to the
test Diamond C3D4 835 displacement load. The stress–strain curve was plotted
Cuboctahedron C3D4 839 based on the measured data. According to the slope of
CFD CPL C3D4 666 the elastic deformation zone in the stress–strain curve,
Diamond C3D4 873 we estimated the elastic modulus of the scaffold, drew
Cuboctahedron C3D4 1096 a straight line using the elastic deformation stage, and
then translated the line by 0.2%. The intersection point
obtained was the yield strength. In order to test the actual
and measured the real pore size and rod diameter using mechanical properties of titanium alloy porous scaffolds
scanning electron microscopy (SEM). Simultaneously, the with different lattice structures, mechanical compression
scaffolds were scanned with micro-computed tomography tests were carried out in vitro. During the experiment, the
(micro-CT; voltage 155 kV, current 120 µA, resolution 17 porous scaffolds with different lattice structures (diameter
µm, projection number 1440, integration time 500 ms).
Then, the VG Studio MAX3.5 software (Volume Graphics, 10 mm, height 10 mm) were placed on the universal test
Germany) was employed to redevelop the 3D structure of machine (C43.104, MTS Ltd., China) to make the long
the scaffold, and the internal structure of the scaffold was axis of the scaffolds consistent with the direction of the
analyzed. The real porosity of the porous Ti6Al4V scaffolds application force (Figure 3B). The load device drops at a
was determined using the dry weight method. In other constant speed of 1 mm/min. According to the software
words, under typical air pressure, the porous scaffolds equipped with the loading system, the stress–strain curve
of each group were in dry state. The actual porosity of was drawn (Figure 3C), and the yield strength and elastic
the scaffolds was computed using the following formulas modulus of the scaffolds were calculated (Table 4).
once the actual weight of the scaffolds was determined 2.4. Computational fluid dynamics analysis
(Equations VII and VIII): Utilizing computational fluid dynamics (CFD), the
m hydrodynamic properties of porous scaffolds with different
V 0 (VII) unit cell types were analyzed. The scaffold model (Φ10
0
mm × 3 mm) was a hard, inflexible body (see Table 2 for
specific parameters). The fluid used was an incompressible
and homogeneous tissue fluid with a temperature of 37°, a
P 1 0 (VIII)
−3
viscosity coefficient (η) of 3.20 × 10 Pa·s, and a density (ρ)
3
of 1060 kg/m . In order to avoid the influence of the fluid
where ρ represents the apparent density (g/cm ), and m domain boundary on the experimental structure, the fluid
3
0
denotes the actual weight (g) of the porous titanium alloy domain size was Φ10 mm × 5 mm, and the porous model
scaffold. V denotes the volume of the porous titanium was positioned at the center of the fluid domain model. We
0
alloy scaffold in its natural state (cm ), P shows the actual defined the fluid inlet surface, the outlet surface, and the
3
porosity of the porous titanium alloy scaffold, and ρ inner wall of the scaffold (Figure 3D). The fluid domain
represents the theoretical density of Ti6Al4V material and rigid surface satisfied the no-slip condition, and the
3
(4.5 g/cm ).
normal and tangential vectors at the fluid–solid interface
2.3. Compressive mechanical testing were both zero. The fluid entered the fluid channel at a
Static simulation analysis was employed to test the flow rate of 0.1 mm/s from the intake surface. The outlet
compressive mechanical properties of porous Ti6Al4V surface of the fluid channel is the fluid outlet, which is
scaffolds with different unit cell structures (Φ10 mm × defined as the free boundary condition, i.e., the pressure
10 mm). Importing 3D models of scaffolds with various is 0 MPa. We investigated the specific surface area of the
unit cell configurations into the Hypermesh program and scaffold (Equation IX) in addition to the fluid flow velocity
using the surface deviation function to mesh the models through the porous scaffold and the shear stress created
is a unique procedure (Figure 3A). The mesh parameters on the scaffold’s inner wall. In addition, the permeability
are illustrated in Table 2. After using the cleanup function of the scaffold was determined using the Darcy formula
and cleanup tools to repair the mesh, the .inp format file (Equation X).
43
Volume 10 Issue 2 (2024) 211 doi: 10.36922/ijb.1698