Page 77 - IJPS-10-1
P. 77

International Journal of
            Population Studies                                             Drivers of COVID-19 vaccination in South Africa


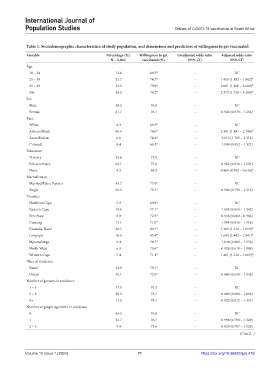
            Table 1. Sociodemographic characteristics of study population, and dimensions and predictors of willingness to get vaccinated
            Variable                          Percentage (%)  Willingness to get   Unadjusted odds ratio   Adjusted odds ratio
                                                N = 5,862    vaccinated (%)      (95% CI)          (95% CI)
            Age
             18 – 24                              12.6           66.5*              -                RC
             25 – 34                              25.7           74.7*              -          1.459 (1.182 – 1.802)*
             35 – 49                              33.2           79.9*              -          2.081 (1.160 – 2.609)*
             50+                                  28.3           78.2*              -          2.372 (1.758 – 3.200)*
            Sex
             Male                                 38.3           76.8               -                RC
             Female                               61.7           76.1               -          0.926 (0.879 – 1.254)
            Race
             White                                 4.3           63.5*              -                RC
             African/Black                        86.5           78.0*              -          2.301 (1.881 – 2.796)*
             Asian/Indian                          0.8           74.4*              -          2.110 (1.705 – 2.318)
             Colored                               8.4           66.2*              -          1.199 (0.952 – 1.321)
            Education
             Tertiary                             33.6           75.9               -                RC
             Below tertiary                       62.1           75.6               -          0.962 (0.816 – 1.124)
             None                                  4.3           69.2               -          0.465 (0.392 – 0.616)*
            Marital status
             Married/Has a Partner                43.7           77.9*              -                RC
             Single                               56.3           75.1*              -          0.996 (0.738 – 1.212)
            Province
             Northern Cape                         5.9           69.9*              -                RC
             Eastern Cape                         10.0           77.1*              -          1.143 (0.855 – 1.342)
             Free State                            6.0           72.5*              -          0.846 (0.662 – 0.906)
             Gauteng                              15.1           71.0*              -          1.004 (0.816 – 1.118)
             Kwazulu-Natal                        28.7           80.1*              -          1.468 (1.318 – 1.659)*
             Limpopo                              10.5           83.4*              -          1.692 (1.442 – 1.941)*
             Mpumalanga                            9.4           74.7*              -          1.048 (0.808 – 1.176)
             North West                            6.0           75.6*              -          0.928 (0.619 – 1.008)
             Western Cape                          7.4           71.2*              -          1.461 (1.218 – 1.665)*
            Place of residence
             Rural                                54.9           79.1*              -                RC
             Urban                                45.1           72.8*              -          0.880 (0.638 – 1.046)
            Number of persons in residence
             1 – 4                                47.5           76.3               -                RC
             5 – 8                                39.3           75.7               -          0.880 (0.608 – 1.038)
             9+                                   13.2           78.4               -          0.922 (0.812 – 1.334)
            Number of people aged 60+ in residence
             0                                    66.3           76.6               -                RC
             1                                    24.7           76.7               -          0.998 (0.798 – 1.329)
             2 – 5                                 9.0           73.6               -          0.839 (0.707 – 1.128)
                                                                                                       (Cont’d...)


            Volume 10 Issue 1 (2024)                        71                         https://doi.org/10.36922/ijps.479
   72   73   74   75   76   77   78   79   80   81   82