
Page 85 - IJPS-10-1
P. 85
International Journal of
Population Studies Perception and acceptance readiness for COVID-19 vaccine
and frequencies. The perception of COVID-19 vaccine was Unsurprisingly, significantly more health workers (7.9%)
rated using 18-point perception scale. A total score of ≤14 have been vaccinated compared with non-health workers
and >14 (the 70 percentile) was categorized as negative (2.1%). On the other hand, more rural dwellers (16.7%)
th
and positive perception, respectively. The acceptance have received the vaccine compared with semi-urban (0.0%)
readiness for COVID-19 vaccine was analyzed using and urban (3.0%) dwellers. We found that marital status,
descriptive and inferential statistics (Chi-square). Reasons educational level, and religion of the respondents were not
for non-willingness were presented as a theme. Differences associated with their status of vaccination (Table 3).
with p < 0.05 were considered statistically significant.
3.4. Acceptance readiness for COVID-19 vaccine
3. Results Among those who were yet to take COVID-19 vaccine
3.1. Sociodemographic characteristics (96.7%), 46.6% were willing to be vaccinated if the vaccines
The mean age of the respondents was 26.6 ± 9.2 years, and were accessible and given free of charge, and only 15.1%
73.2% of them were single. The majority of the respondents of the respondents expressed willingness to take the
were males (52.5%), and more than half (58.1%) had tertiary vaccine even if they need to pay for the vaccine (Table 4).
education degree while 41.9% had attained secondary Age, sex, marital status, being a health worker, type of
education. Most of the responses (80.5%) were from the residence, and level of education had no association with
South-West geopolitical region, while the South-South acceptance readiness for COVID-19 vaccine (Table 5).
region contributed the least number of responses to this Major reasons for non-readiness were doubt about vaccine
survey. Furthermore, most of the respondents were urban
dwellers. Slightly more than one-fifth of the respondents Table 1. Sociodemographic characteristics of respondents
were health workers (21.9%) as shown in Table 1.
Variable Frequency Percentage
3.2. Perception of COVID-19 vaccine Sex
Male 157 52.5
Through this survey, we found that the majority of the Female 142 47.5
respondents (71.2%) had negative perception toward the Age group
COVID-19 vaccine. Some of the respondents (23.8%) 16–30 207 69.5
agreed that the COVID-19 vaccine at that time was not 31–45 79 26.5
effective and few opined that COVID-19 is not real, so a >45 12 4.0
vaccine for it is not needed (Table 2). Mean age 26.6±9.2
Marital status
3.3. COVID-19 vaccination Single 221 73.2
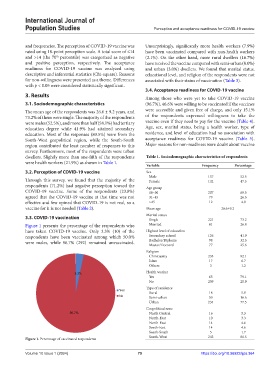
Figure 1 presents the percentage of the respondents who Married 81 26.8
have taken COVID-19 vaccine. Only 3.3% (10) of the Highest level of education
respondents have been vaccinated among which 50.0% Secondary school 126 41.9
were males, while 96.7% (292) remained unvaccinated. Bachelor/Diploma 98 32.5
77
Master/Doctoral
25.6
Religion
Christianity 233 92.1
Islam 17 6.7
Others 3 1.2
3.3% Health worker
Yes 63 79.1
No 239 20.9
Type of residence
Yes Rural 18 5.9
No Semi-urban 50 16.6
Urban 234 77.5
Geopolitical zone
96.7% North Central 16 5.3
North-East 10 3.3
North-East 14 4.6
South-East 14 4.6
South-South 5 1.7
South-West 243 80.5
Figure 1. Percentage of vaccinated respondents
Volume 10 Issue 1 (2024) 79 https://doi.org/10.36922/ijps.364