
Page 100 - IJPS-10-3
P. 100
International Journal of
Population Studies Pandemic impacts preschoolers’ movement behaviors
even with small samples. To choose the correlation structure, more active, outdoor activities (more than 1 h) during
the quasi-likelihood under the independence model weekdays decreased. Similar results were observed for
criterion (QIC) was utilized (Pan, 2001). A lower QIC value the same variable during the weekends, except for the
indicated the best correlation matrix to be chosen for the reduction in the percentage of preschoolers engaged in
model. Therefore, the gamma family, the log link function, <1 h of outdoor PA during the pandemic. The percentage
and the autoregressive correlation (AR) matrix were used of children that spent 1 h on indoor PA increased on
for all the models. Beta coefficients (β) were estimated for weekdays and weekends during the pandemic. Conversely,
continuous data, and odds ratio (OR) and their respective the percentage of those who spent more than 1 h on indoor
confidence intervals were determined for categorical data. activities decreased (Table 1).
Analyses were performed using the Statistical Package for When comparing time spent on movement behaviors
the Social Sciences (SPSS; version 26.0 for Windows), and before and during the pandemic, the results highlighted
the level of significance was set at p < 0.05. that during the pandemic: (i) sleep time increased 73.3 min/
day (β = 0.12; p < 0.01); (ii) screen time during weekdays
3. Results increased 184.5 min/day (β = 0.59; p < 0.01); 87.0 min/day
Our findings revealed that the time spent by preschoolers during weekend days (β = 0.26; p < 0.01); and 160.5 min/
on sleeping and sedentary activities, on weekdays and day, when considering the average amount of time for the
weekends, had significantly lengthened during the entire week (β = 0.50; p < 0.001) (Table 2).
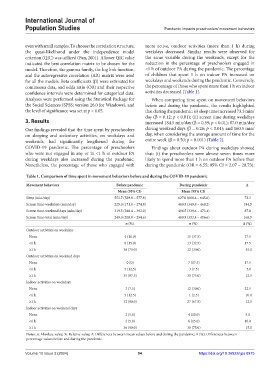
COVID-19 pandemic. The percentage of preschoolers Findings about outdoor PA during weekdays showed
who were not engaged in any or in <1 h of outdoor PA that: (i) the preschoolers were almost seven times more
during weekdays also increased during the pandemic. likely to spend more than 1 h on outdoor PA before than
Nonetheless, the percentage of those who engaged with during the pandemic (OR = 6.55; 95% CI = 2.07 – 20.73);
Table 1. Comparison of time spent in movement behaviors before and during the COVID‑19 pandemic
Movement behaviors Before pandemic During pandemic Δ
Mean (95% CI) Mean (95% CI)
Sleep (min/day) 553.7 (529.8 – 577.8) 627.0 (608.4 – 645.6) 73.3
Screen time-weekdays (min/day) 225.0 (171.0 – 274.8) 409.5 (349.8 – 469.2) 184.5
Screen time-weekend days (min/day) 319.5 (248.4 – 393.0) 406.5 (339.6 – 473.4) 87.0
Screen time-total (min/day) 249.0 (205.8 – 294.6) 409.5 (353.4 – 456.6) 160.5
n (%) n (%) Δ (%)
Outdoor activities on weekdays
None 4 (10.0) 15 (37.5) 27.5
<1 h 6 (15.0) 13 (32.5) 17.5
≥1 h 30 (75.0) 12 (30.0) −45.0
Outdoor activities on weekend days
None 0 (0) 7 (17.5) 17.5
<1 h 5 (12,5) 3 (7.5) −5.0
≥1 h 35 (87.5) 30 (75.0) −12.5
Indoor activities on weekdays
None 3 (7.5) 12 (30.0) 22.5
<1 h 5 (12.5) 1 (2.5) −10.0
≥1 h 32 (80.0) 27 (67.5) −12.5
Indoor activities on weekend days
None 2 (5.0) 4 (10.0) 5.0
<1 h 2 (5.0) 6 (15.0) 10.0
≥1 h 36 (90.0) 30 (75.0) −15.0
Notes: n: Absolute value; %: Relative value; Δ: Differences between mean values before and during the pandemic; Δ (%): Differences between
percentage values before and during the pandemic.
Volume 10 Issue 3 (2024) 94 https://doi.org/10.36922/ijps.0975