
Page 24 - IJPS-5-2
P. 24
Risk factors of child undernutrition in India
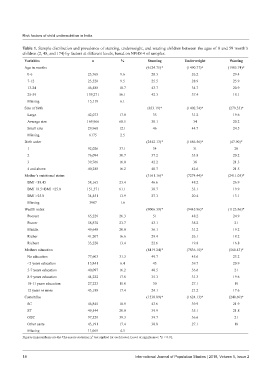
Table 1. Sample distribution and prevalence of stunting, underweight, and wasting children between the ages of 0 and 59 month’s
children (2, 48, and 174) by factors at different levels, based on NFHS-4 of samples.
Variables n % Stunting Underweight Wasting
Age in months (6124.75)* (1490.77)* (1985.74)*
0-6 23,768 9.6 20.3 26.2 29.4
7-12 23,528 9.5 25.5 28.9 25.9
13-24 46,488 18.7 43.7 34.7 20.9
25-59 139,271 56.1 42.3 37.4 18.1
Missing 15,119 6.1
Size at birth (833.19)* (1402.74)* (279.33)*
Large 42,073 17.0 35 31.2 19.6
Average size 169,966 68.5 38.1 34 20.2
Small size 29,960 12.1 46 44.7 24.5
Missing 6175 2.5
Birth order (2542.13)* (1686.56)* (47.90)*
1 92,026 37.1 34 31 20
2 76,094 30.7 37.2 33.8 20.2
3 39,766 16.0 42.2 38 21.3
4 and above 40,288 16.2 48.7 42.6 21.5
Mother’s nutritional status (3161.16)* (7274.44)* (2411.05)*
BMI <18.45 58,165 23.4 46.6 48.2 26.9
BMI 18.5<BMI <25.0 151,571 61.1 38.7 33.1 19.9
BMI >25.0 34,451 13.9 27.3 20.4 13.1
Missing 3987 1.6
Wealth index (9006.39)* (9445.96)* (1123.86)*
Poorest 65,229 26.3 51 48.2 24.9
Poorer 58,870 23.7 43.1 38.2 21
Middle 49,648 20.0 36.1 31.2 19.2
Richer 41,207 16.6 29.4 26.1 18.2
Richest 33,220 13.4 22.6 19.8 16.8
Mothers education (8419.24)* (7836.10)* (560.43)*
No education 77,603 31.3 49.7 45.6 23.2
<5 years education 15,841 6.4 45 39.7 20.9
5-7 years education 40,097 16.2 40.5 36.6 21
8-9 years education 44,222 17.8 35.3 31.3 19.6
10-11 years education 27,223 11.0 30 27.1 19
12 years or more 43,188 17.4 24.1 21.2 17.6
Caste/tribe (1538.89)* (1624.13)* (240.69)*
SC 46,845 18.9 43.6 39.9 21.9
ST 49,544 20.0 39.9 35.1 21.8
OBC 97,529 39.3 39.7 36.6 21
Other caste 43,191 17.4 30.8 27.1 18
Missing 11,065 4.5
2
Figures in parenthesis are the Chi-square statistics; c test applied for each factor. Level of significance: *p < 0.01.
18 International Journal of Population Studies | 2019, Volume 5, Issue 2