Page 114 - IJPS-7-1
P. 114

Female genital mutilation practice in Senegal

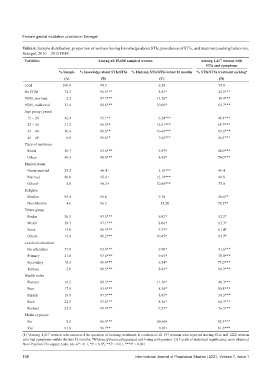
           Table 6. Sample distribution, proportion of women having knowledge about STIs, prevalence of STIs, and treatment seeking behaviors,
           Senegal, 2010 – 2011 DHS.
           Variables                       Among all 15,688 sampled women             Among 1,417 women with
                                                                                         STIs and symptoms
                          % Sample   % knowledge about STIs/STSs  % Had any STIs/STSs in last 12 months  % STIs/STSs treatment seeking a
                            (A)             (B)                      (C)                      (D)
           Total            100.0           94.5                    9.20                      59.8
           No FGM             74.3             96.5***                8.83*                      42.5***
           FGM, non-trad.       2.2            87.7***              13.26*                       50.9***
           FGM, traditional    23.4            94.6***              10.00*                       63.7***
           Age group (years)
             15 – 24          42.4            95.1**                    6.24***                  48.4***
             25 – 34          31.2            96.4**                  12.61***                   65.7***
             35 – 44          20.4            96.6**                  10.60***                   65.6***
             45 – 49            6.0           95.6**                    7.62***                  46.5***
           Place of residence
             Rural            50.7             93.4***                9.87*                      48.0***
             Urban            49.3             98.4***                8.40*                      74.0***
           Marital status
             Never married    29.2            96.4+                     2.18***               49.4
             Married          66.0            95.6+                   12.19***                60.8
             Others b           4.8           96.2+                   10.80***                57.0
           Religion
             Muslim           95.4          95.8                    9.10                        58.6**
             Non-Muslim         4.6         96.5                                        11.28     78.5**
           Ethnic group
             Poular           26.5             93.5***                9.82*                    52.2*
             Wolof            38.7             97.1***                8.06*                    63.3*
             Serer            15.0             96.3***                9.37*                    61.4*
             Others           19.8             96.2***              10.45*                     62.7*
           Levels of education
             No education     57.9             93.9***                9.90*                      51.6***
             Primary          21.8             97.6***                9.65*                      70.0***
             Secondary        18.3             99.4***                6.54*                      75.0***
             Tertiary           2.0            99.5***                8.45*                      98.3***
           Wealth index
             Poorest          16.5             88.3***              11.56*                       40.3***
             Poor             17.9             93.9***                8.38*                      50.5***
             Middle           19.9             97.5***                8.83*                      58.5***
             Rich             22.3             97.8***                8.36*                      68.7***
             Richest          23.5             99.4***                9.27*                      76.5***
           Media exposure
             No                 8.2            86.4***              10.69+                       42.3***
             Yes              91.8            96.7**                  9.07+                      61.6***
             a
           (1)  Among 1,417 women who answered the question of seeking treatment. It consists of all 197 women who reported having STIs and 1222 women
           who had symptoms within the last 12 months.  Widowed/divorced/separated and living with partner. (3) Levels of statistical significance were obtained
                                        b
           from Pearson Chi-square tests. (4) +P < 0.1, *P < 0.05, **P < 0.01, ***P < 0.001
           108                                             International Journal of Population Studies | 2021, Volume 7, Issue 1
   109   110   111   112   113   114   115   116   117   118   119