
Page 59 - IJPS-9-1
P. 59
International Journal of
Population Studies Neighborhood social cohesion and self-reported depression
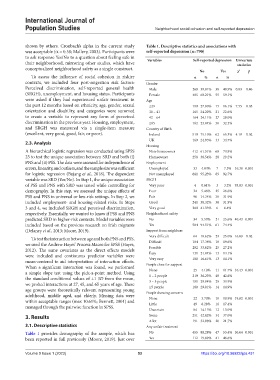
shown by others. Cronbach’s alpha in the current study Table 1. Descriptive statistics and associations with
was acceptable (α = 0.58; Mallery, 2003). Participants were self‑reported depression (n=790)
to ask response Yes/No to a question about feeling safe in Variables Self‑reported depression Univariate
their neighborhood, mirroring other studies, which have statistics
conceptualized neighborhood safety as a single construct.
No Yes χ 2 p
To assess the influence of social cohesion in riskier n % n %
contexts, we included four post-migration risk factors: Gender
Perceived discrimination, self-reported general health Male 268 39.81% 38 40.9% 0.03 0.46
(SRGH), unemployment, and housing status. Participants Female 405 60.21% 55 59.1%
were asked if they had experienced unfair treatment in Age
the past 12 months based on ethnicity, age, gender, sexual ≤29 190 27.90% 15 16.1% 7.55 0.05
orientation and disability, and categories were summed 30 – 41 165 24.22% 21 22.6%
to create a variable to represent any form of perceived 42 – 64 164 24.11% 27 29.0%
discrimination in the previous year. Housing, employment, ≥65 162 23.84% 30 32.3%
and SRGH was measured via a single-item measure Country of Birth
(excellent, very good, good, fair, or poor). Ireland 510 75.10% 62 65.3% 4.19 0.02
UK 169 24.93% 33 34.7%
2.3. Analysis
Housing
A hierarchical logistic regression was conducted using SPSS Non-homeowner 412 61.51% 68 70.8%
23 to test the unique association between SRD and both (i) Homeowner 258 38.54% 28 29.2%
PNS and (ii) PSS. The data were assessed for independence of Employment
errors, linearity, and outliers, and the sample size was sufficient Unemployed 33 4.84% 7 7.3% 16.38 0.001
for logistic regression (Bujang et al., 2018). The dependent Not unemployed 661 95.23% 89 92.7%
variable was SRD (Yes/No). In Step 1, the unique association SRGH
of PSS and PNS with SRD was tested while controlling for Very poor 4 0.61% 3 3.2% 93.83 0.001
demography. In this step, we assessed the unique effects of Poor 34 5.46% 25 26.6%
PSS and PNS in universal or low-risk settings. In Step 2, we Fair 90 14.34% 30 31.9%
included employment- and housing-related risks. In Steps Good 241 38.32% 30 31.9%
3 and 4, we included SRGH and perceived discrimination, Very good 260 41.33% 6 6.4%
respectively. Essentially, we wanted to know if PSS and PNS Neighborhood safety
predicted SRD in higher-risk contexts. Model variables were No 34 5.50% 21 25.6% 40.43 0.001
included based on the previous research on Irish migrants Yes 584 94.51% 61 74.4%
(Delaney et al., 2013; Moore, 2019). Support from neighbors
Very difficult 64 10.62% 23 25.0% 16.89 0.02
To test the interaction between age and both PNS and PSS,
we used the Andrew Hayes’ Process Macro for SPSS (Hayes, Difficult 104 17.38% 18 19.6%
2012). The same covariates as the direct effects models Possible 202 33.62% 25 27.2%
were included and continuous predictor variables were Easy 131 21.84% 13 14.1%
mean-centered to aid interpretation of interaction effects. Very easy 100 16.61% 13 14.1%
When a significant interaction was found, we performed People close for support
a simple slope test using the pick-a-point method. Using None 25 4.10% 11 11.7% 16.43 0.001
the standard conditional values of ±1 SD from the mean, 1 – 2 people 219 36.23% 40 42.6%
we probed interactions at 27, 45, and 65 years of age. These 3 – 5 people 181 29.94% 29 30.9%
≥5 people
age groups were theoretically relevant representing young People showing concern 180 29.81% 14 14.9%
adulthood, middle aged, and elderly. Missing data were None 22 3.70% 10 10.9% 19.82 0.001
within acceptable ranges (max 10.61%; Bennett, 2001) and Little 49 8.28% 16 17.4%
managed through the pairwise function in SPSS.
Uncertain 84 14.15% 12 13.0%
3. Results Some 251 42.02% 34 37.0%
A lot 191 32.08% 20 21.7%
3.1. Descriptive statistics Any unfair treatment
Table 1 provides demography of the sample, which has No 455 80.28% 47 53.4% 30.64 0.001
been reported in full previously (Moore, 2019). Just over Yes 112 19.89% 41 46.6%
Volume 9 Issue 1 (2023) 53 https://doi.org/10.36922/ijps.431