
Page 29 - IJPS-9-2
P. 29
International Journal of
Population Studies Dominant drivers of inequalities in child survival
Appendixes
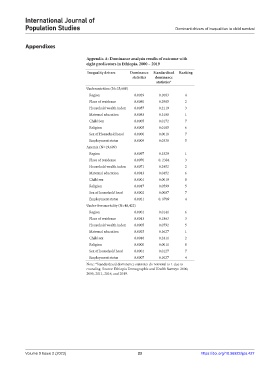
Appendix A: Dominance analysis results of outcome with
eight predicators in Ethiopia, 2000 – 2019
Inequality drivers Dominance Standardized Ranking
statistics dominance
statistics*
Undernutrition (N=35,688)
Region 0.0029 0.1083 4
Place of residence 0.0080 0.2985 2
Household wealth index 0.0057 0.2119 3
Maternal education 0.0083 0.3100 1
Child Sex 0.0005 0.0172 7
Religion 0.0005 0.0185 6
Sex of Household head 0.0000 0.0018 7
Employment status 0.0009 0.0338 5
Anemia (N=19,699)
Region 0.0097 0.3329 1
Place of residence 0.0070 0. 2384 3
Household wealth index 0.0071 0.2452 2
Maternal education 0.0013 0.0452 6
Child sex 0.0001 0.0019 8
Religion 0.0017 0.0599 5
Sex of household head 0.0002 0.0007 7
Employment status 0.0021 0. 0709 4
Under-five mortality (N=48,422)
Region 0.0001 0.0141 6
Place of residence 0.0013 0.1863 3
Household wealth index 0.0005 0.0792 5
Maternal education 0.0025 0.3627 1
Child sex 0.0016 0.2411 2
Religion 0.0000 0.0011 8
Sex of household head 0.0001 0.0127 7
Employment status 0.0007 0.1027 4
Note: *Standardized dominance statistics do not total to 1 due to
rounding. Source: Ethiopia Demographic and Health Surveys: 2000,
2005, 2011, 2016, and 2019.
Volume 9 Issue 2 (2023) 23 https://doi.org/10.36922/ijps.427