
Page 86 - IJPS-9-3
P. 86
International Journal of
Population Studies Human development, population, and environmental burden
(Riahi et al., 2017). With SSP2, the world temperature
should rise by 3.8 – 4.2°C.
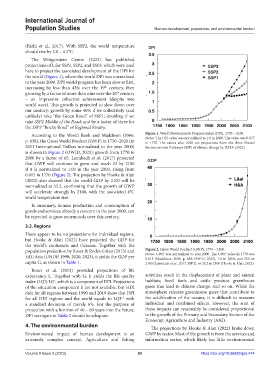
The Wittgenstein Centre (2022) has published
projections of L for SSP1, SSP2, and SSP3, which were used
here to project the associated development of the DPI for
the world (Figure 1), where the world DPI was normalized
to the year 2000. DPI world progress has been slow at first,
increasing by less than 43% over the 19 century, then
th
growing by a factor of more than nine over the 20 century
th
– an impressive collective achievement (despite two
world wars). This growth is projected to slow down over
our century: growth by some 40% if we collectively (and
unlikely) take “the Green Road” of SSP1; doubling if we
take SSP2 Middle of the Road; and by a factor of three for
the SSP3 “Rocky Road” of Regional Rivalry.
According to the World Bank and Maddison (2006, Figure 1. World Development Progress Index (DPI), 1770 – 2100.
p. 638), the Gross World Product (GWP) in 1750–2020 (in Notes: The DPI value was normalized to 1.0 in 2000. The value was 0.077
in 1770. The values after 2020 are projections from the three Shared
2011 International Dollars normalized to the year 2000) Socioeconomic Pathways (SSP) of climate change by IIASA (2022).
is shown in Figure 2 (OWID, 2023): growth from 1770 to
2000 by a factor of 65. Leimbach et al. (2017) projected
that GWP will continue to grow and reach 32 by 2100
if it is normalized to 1.00 in the year 2000, rising from
0.015 in 1770 (Figure 2). The projection by Hooke & Alati
(2022) also showed that the world GDP by 2100 will be
normalized at 35.2, confirming that the growth of GWP
will accelerate strongly by 2100, with the associated 4°C
world temperature rise.
In summary, human production and consumption of
goods and services, already a concern in the year 2000, can
be expected to grow enormously over this century.
3.2. Regions
There appear to be no projections for individual regions,
but Hooke & Alati (2022) have projected the GDP for
the world’s continents and Oceania. Together with the
population projection by Roser & Rodés-Girao (2013) and Figure 2. Gross World Product (GWP), 1770 – 2100.
Notes: GWP was normalized to year 2000. The GWP value in 1770 was
HDI data (UNDP, 1990; 2020; 2023), it yields the GDP per 0.015 (Maddison, 2006, p. 638; OWID, 2023), 1.0 in 2000, and 32.0 in
capita G, as shown in Table 1. 2100 (Leimbach et al., 2017, SSP2), or 35.2 in 2100 (Hooke & Alati, 2022).
Roser et al. (2013) provided projections of life
expectancy L. Together with G, it yields the life quality activities result in the displacement of plant and animal
index (LQI) LG , which is a component of DPI. Projections habitats; fossil fuels and cattle produce greenhouse
c
of the education component E are not available, but HDI gases that lead to climate change, and so on. While the
data for all regions between 1990 and 2019 show that DPI atmosphere releases greenhouse gases that contribute to
for all HDI regions and the world equals to LQI with the acidification of the oceans, it is difficult to measure
1.5
a standard deviation of merely 6%. For the purpose of individual and combined effects. However, the sum of
projection with a horizon of 40 – 80 years into the future, these impacts can reasonably be considered proportional
DPI surrogate in Table 2 should be adequate. to the growth of the Primary and Secondary Sectors of the
Economy: Agriculture and Industry (A&I).
4. The environmental burden The projections by Hooke & Alati (2022) broke down
Environmental impact of human development is an GWP by sector. Most of the growth is from the services and
extremely complex concept. Agriculture and fishing information sector, which likely has little environmental
Volume 9 Issue 3 (2023) 80 https://doi.org/10.36922/ijps.474