
Page 61 - JCAU-6-3
P. 61
Journal of Chinese
Architecture and Urbanism Age-friendly smart communities in Beijing
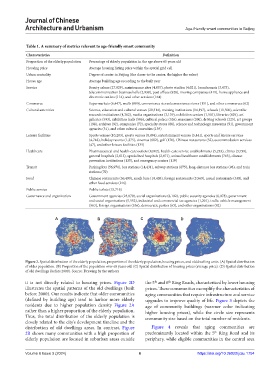
Table 1. A summary of metrics relevant to age-friendly smart community
Characteristics Definition
Proportion of the elderly population Percentage of elderly population in the age above 65 years old
Housing price Average housing listing price within the spatial grid cell
Urban centrality Degree of center in Beijing (the closer to the center, the higher the value)
House age Average building age according to the built year
Service Beauty salons (27,929), maintenance sites (4,057), photo studios (4,021), laundromats (3,473),
telecommunication business halls (2,938), post offices (928), moving companies (419), home appliance and
electronic outlets (114), and other services (164)
Commerce Supermarkets (6,447), malls (890), convenience stores/convenience stores (151), and other commerces (62)
Cultural amenities Science, education and cultural venues (20,314), training institutions (14,197), schools (11,500), scientific
research institutions (4,382), media organizations (3,139), exhibition centers (1,501), libraries (629), art
galleries (593), exhibition halls (586), cultural palace (526), museums (260), driving schools (225), art groups
(198), archives (92), companies (72), specialty stores (60), science and technology museums (51), government
agencies (31), and other cultural amenities (139)
Leisure facilities Sports venues (10,203), sports venues (8,494), entertainment venues (5,441), sports and leisure services
(4,748), holiday resorts (1,375), cinemas (602), golf (170), Chinese restaurants (52), accommodation services
(47), and other leisure facilities (135)
Healthcare Pharmaceutical and health-care outlets (8,002), health-care service establishments (5,233), clinics (3,739),
general hospitals (2,815), specialized hospitals (2,471), animal healthcare establishments (763), disease
prevention institutions (135), and emergency centers (119)
Transit Parking lots (56,970), bus stations (14,431), subway stations (675), long-distance bus stations (98), and train
stations (70)
Food Chinese restaurants (56,490), snack bars (10,403), foreign restaurants (3,569), casual restaurants (330), and
other food services (216)
Public service Public toilets (15,716)
Governance and organization Government agencies (23,879), social organizations (8,102), public security agencies (6,078), government
and social organizations (5,552), industrial and commercial tax agencies (1,201), traffic vehicle management
(563), foreign organizations (536), democratic parties (63), and other organizations (42)
A B C D
Figure 2. Spatial distribution of the elderly population, proportion of the elderly population, housing prices, and old dwelling units. (A) Spatial distribution
of older population. (B) Proportion of the population over 65 years old. (C) Spatial distribution of housing prices (average price). (D) Spatial distribution
of old dwellings (before 2000). Source: Drawing by the authors
it is not directly related to housing prices. Figure 2D the 5 and 6 Ring Roads, characterized by lower housing
th
th
illustrates the spatial patterns of the old dwellings (built prices. These communities exemplify the characteristics of
before 2000). Our results indicate that older communities aging communities that require infrastructure and service
(defined by building age) tend to harbor more elderly upgrades to improve quality of life. Figure 3 depicts the
residents due to higher population density Figure 2A age of community buildings (warmer color indicating
rather than a higher proportion of the elderly population. higher housing prices), while the circle size represents
Thus, the total distribution of the elderly population is community size based on the total number of residents.
closely related to the city’s development timeline and the
distribution of old dwellings areas. In contrast, Figure Figure 4 reveals that aging communities are
2B shows many communities with a high proportion of predominantly located within the 5 Ring Road and its
th
elderly population are located in suburban areas outside periphery, while eligible communities in the central area
Volume 6 Issue 3 (2024) 6 https://doi.org/10.36922/jcau.1754