
Page 55 - AC-1-2
P. 55
Arts & Communication Art images and trauma in femicide orphans
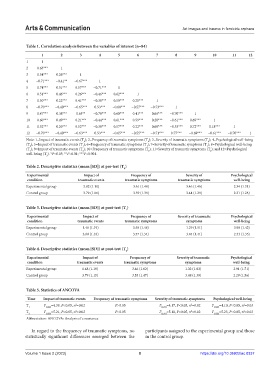
Table 1. Correlation analysis between the variables of interest (n=84)
1 2 3 4 5 6 7 8 9 10 11 12
1 1
2 0.63*** 1
3 0.54*** 0.26*** 1
4 −0.71*** −0.41** −0.67*** 1
5 0.74*** 0.51*** 0.57*** −0.71*** 1
6 0.51*** 0.46*** 0.26*** −0.46*** 0.62*** 1
7 0.50*** 0.22*** 0.41*** −0.38*** 0.59*** 0.20*** 1
8 −0.70*** −0.40*** −0.65*** 0.53*** −0.68*** −0.57*** −0.73*** 1
9 0.47*** 0.38*** 0.65** −0.70*** 0.60*** 0.41*** 0.66*** −0.70*** 1
10 0.60*** 0.49*** 0.21*** −0.44*** 0.61*** 0.59*** 0.20*** −0.61*** 0.69*** 1
11 0.52*** 0.20*** 0.52*** −0.38*** 0.57*** 0.22*** 0.60*** −0.53*** 0.72*** 0.18*** 1
12 −0.70*** −0.40*** −0.63*** 0.53*** −0.65*** −0.55*** −0.71*** 0.77*** −0.69*** −0.61*** −0.70*** 1
Note: 1=Impact of traumatic events (T ); 2=Frequency of traumatic symptoms (T ); 3=Severity of traumatic symptoms (T ); 4=Psychological well-being
0
0
0
(T ); 5=Impact of traumatic events (T ); 6=Frequency of traumatic symptoms (T ); 7=Severity of traumatic symptoms (T ); 8=Psychological well-being
1
1
0
1
(T ); 9=Impact of traumatic events (T ); 10=Frequency of traumatic symptoms (T ); 11=Severity of traumatic symptoms (T ); and 12=Psychological
2
2
1
2
well-being (T ). *P<0.05; **P<0.01; ***P<0.001.
2
Table 2. Descriptive statistics (mean [SD]) at pre‑test (T )
0
Experimental Impact of Frequency of Severity of Psychological
condition traumatic events traumatic symptoms traumatic symptoms well‑being
Experimental group 3.82 (1.10) 3.61 (1.40) 3.46 (1.46) 2.34 (1.31)
Control group 3.79 (1.06) 3.59 (1.39) 3.44 (1.29) 2.31 (1.28)
Table 3. Descriptive statistics (mean [SD]) at post‑test (T )
1
Experimental Impact of Frequency of Severity of traumatic Psychological
condition traumatic events traumatic symptoms symptoms well‑being
Experimental group 1.46 (1.19) 3.58 (1.48) 1.29 (1.51) 3.98 (1.42)
Control group 3.80 (1.18) 3.57 (1.34) 3.44 (1.41) 2.33 (1.35)
Table 4. Descriptive statistics (mean [SD]) at post‑test (T )
2
Experimental Impact of Frequency of Severity of traumatic Psychological
condition traumatic events traumatic symptoms symptoms well‑being
Experimental group 1.48 (1.18) 3.46 (1.62) 1.32 (1.83) 3.91 (1.71)
Control group 3.79 (1.15) 3.55 (1.47) 3.48 (1.39) 2.29 (1.56)
Table 5. Statistics of ANCOVA
Time Impact of traumatic events Frequency of traumatic symptoms Severity of traumatic symptoms Psychological well‑being
2
T F =4.39, P<0.05, n =0.02 P>0.05 F =4.17, P<0.05, n =0.02 F =4.10, P<0.05, n =0.03
2
2
1 (2,82) (2,82) (2,82)
T F =5.21, P<0.05, n =0.02 P>0.05 F =5.18, P<0.05, n =0.02 F =5.23, P<0.05, n =0.03
2
2
2
2 (2,82) (2,82) (2,82)
Abbreviation: ANCOVA: Analysis of covariance.
In regard to the frequency of traumatic symptoms, no participants assigned to the experimental group and those
statistically significant differences emerged between the in the control group.
Volume 1 Issue 2 (2023) 8 https://doi.org/10.36922/ac.0337