
Page 128 - AC-3-3
P. 128
Arts & Communication Emotional experience of listening to music
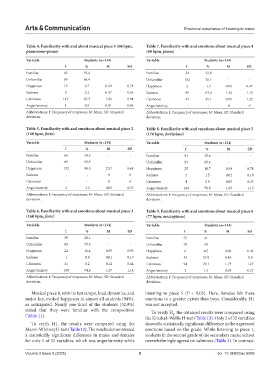
Table 4. Familiarity with and about musical piece 1 (60 bpm, Table 7. Familiarity with and emotions about musical piece 4
pianissimo–piano) (60 bpm, piano)
Variable Students (n=134) Variable Students (n=134)
f % M SD f % M SD
Familiar 45 33.6 - - Familiar 32 23.9 - -
Unfamiliar 89 66.4 - - Unfamiliar 102 76.1 - -
Happiness 13 9.7 0.22 0.71 Happiness 2 1.5 0.05 0.47
Sadness 3 2.2 0.37 0.26 Sadness 85 63.4 1.24 1.13
Calmness 117 87.3 1.93 0.94 Calmness 47 35.1 0.85 1.22
Anger/anxiety 1 0.8 0.01 0.86 Anger/anxiety - - 0 0
Abbreviations: f: Frequency of responses; M: Mean; SD: Standard Abbreviations: f: Frequency of responses; M: Mean; SD: Standard
deviation. deviation.
Table 5. Familiarity with and emotions about musical piece 2 Table 8. Familiarity with and emotions about musical piece 5
(168 bpm, forte) (176 bpm, fortissimo)
Variable Students (n=134) Variable Students (n=134)
f % M SD f % M SD
Familiar 65 48.5 - - Familiar 41 30.6 - -
Unfamiliar 69 51.5 - - Unfamiliar 93 69.4 - -
Happiness 132 98.5 2.57 0.68 Happiness 25 18.7 0.34 0.78
Sadness - - 0 0 Sadness 2 1.5 0.02 0.19
Calmness - - 0 0 Calmness 4 2.9 0.05 0.33
Anger/anxiety 2 1.5 0.05 0.37 Anger/anxiety 104 76.9 1.65 1.13
Abbreviations: f: Frequency of responses; M: Mean; SD: Standard Abbreviations: f: Frequency of responses; M: Mean; SD: Standard
deviation. deviation.
Table 6. Familiarity with and emotions about musical piece 3 Table 9. Familiarity with and emotions about musical piece 6
(160 bpm, forte) (77 bpm, mezzopiano)
Variable Students (n=134) Variable Students (n=134)
f % M SD f % M SD
Familiar 39 29.1 - - Familiar 55 41 - -
Unfamiliar 95 70.9 - - Unfamiliar 79 59 - -
Happiness 22 16.4 0.39 0.93 Happiness 6 4.5 0.08 0.43
Sadness 1 0.8 0.01 0.17 Sadness 32 23.9 0.40 0.8
Calmness 11 8.2 0.12 0.44 Calmness 94 70.1 1.73 1.27
Anger/anxiety 100 74.6 1.57 1.14 Anger/anxiety 2 1.5 0.03 0.27
Abbreviations: f: Frequency of responses; M: Mean; SD: Standard Abbreviations: f: Frequency of responses; M: Mean; SD: Standard
deviation. deviation.
Musical piece 8, with its fast tempo, loud dynamics, and listening to piece 5 (P < 0.05). Here, females felt these
major key, evoked happiness in almost all students (94%), emotions to a greater extent than boys. Considerably, H1
as anticipated. Nearly one-third of the students (32.8%) was not accepted.
stated that they were familiar with the composition To verify H , the obtained results were compared using
(Table 11). the Kruskal–Wallis H-test (Table 13). Only 2 of 32 variables
2
To verify H1, the results were compared using the showed a statistically significant difference in the expressed
Mann–Whitney U-test (Table 12). The results demonstrated emotions based on the grade. While listening to piece 1,
a statistically significant difference in males and females students in the second grade of the secondary music school
for only 1 of 32 variables, which was anger/anxiety while overwhelmingly agreed on calmness (Table 4). In contrast,
Volume 3 Issue 3 (2025) 5 doi: 10.36922/ac.6009