
Page 57 - AIH-2-2
P. 57
Artificial Intelligence in Health Predicting ICU mortality: A stacked ensemble model
meta-model (Level-1), by combining the aforementioned only hyperparameter variation was that the first CatBoost
predictions and effectively learning to weight the model had a depth of 8, whereas the second had a depth
predictions of each Level-0 model. Taken together, the of 7. Moreover, the importance of the second CatBoost
stacked ensemble learning outputs the final predictions model was equal to 1. Guided by the feature importance
and delivers more accurate and robust results. analysis of the respective classifier, the second CatBoost
model reduced its training feature vector by excluding
Analogous to Figure 3, Level-0 consisted of two the following features: hepatic failure, leukemia, AIDS,
non-identical CatBoost models and a Random Forests lymphoma, cirrhosis, and immunosuppression. Finally,
one. The initial CatBoost model, assigned the highest the Random Forests model classifier was implemented
importance weight equal to 27. The model was trained using the Gini impurity criterion, a broadly used metric
with a learning rate of 0.1 and a Random Subspace for evaluating split quality during tree construction. The
Method of 0.9. The second CatBoost model utilized number of all features considered for node splitting was
mainly the same hyperparameters, except from one. The reduced by setting the maximum features parameter to
70%. Finally, a minimum of 30 samples per node split was
enforced, and the maximum tree depth was constrained to
7 nodes. These hyperparameter settings contributed to the
overall efficacy of the ensemble learning strategy.
After extensive validation and performance evaluation,
we concluded to the aforementioned ensemble structure.
The subsequent section describes the results from the
validation and evaluation methods used in this study.
4. Results
The 10-fold cross-validation approach was employed,
to improve generalization ability and to reduce the
possibility of overfitting. Cross-validation maximized
model generalization by minimizing the bias potential
associated with single train-test splits, resulting in an
evaluation that is more robust and trustworthy. The trained
models were evaluated using a variety of metrics, such as
F , accuracy, precision, and recall, each of which offered a
1
unique perspective on this binary medical categorization
task. The optimal architecture was selected based on a
comprehensive comparison of the metrics, with particular
emphasis placed on the F score.
1
A comparative examination of the F scores attained
1
by the various models examined in this research is
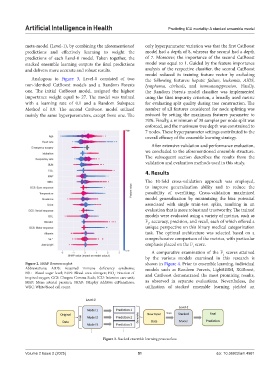
Figure 2. SHAP Beeswarm plot shown in Figure 4. Prior to ensemble learning, individual
Abbreviations: AIDS: Acquired immune deficiency syndrome; models such as Random Forests, LightGBM, XGBoost,
BSL: Blood sugar level; BUN: Blood urea nitrogen; FiO : Fraction of and CatBoost demonstrated the most promising results,
2
inspired oxygen; GCS: Glasgow Comma Scale; ICU: Intensive care unit;
MAP: Mean arterial pressure; SHAP: SHapley Additive exPlanations; as observed in separate evaluations. Nevertheless, the
WBC: White blood cell count. utilization of stacked ensemble learning yielded an
Figure 3. Stacked ensemble learning process flow
Volume 2 Issue 2 (2025) 51 doi: 10.36922/aih.4981