
Page 50 - {PDF Title}
P. 50
Adhikari and Neupane
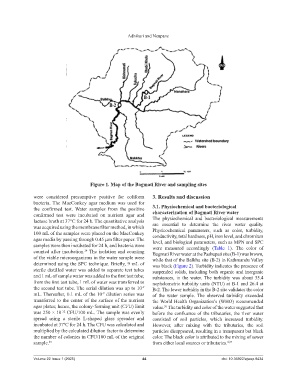
Figure 1. Map of the Bagmati River and sampling sites
were considered presumptive positive for coliform 3. Results and discussion
bacteria. The MacConkey agar medium was used for
the confirmed test. Water samples from the positive 3.1. Physiochemical and bacteriological
confirmed test were incubated on nutrient agar and characterization of Bagmati River water
lactose broth at 37°C for 24 h. The quantitative analysis The physiochemical and bacteriological measurements
are essential to determine the river water quality.
was acquired using the membrane filter method, in which Physicochemical parameters, such as color, turbidity,
100 mL of the samples were placed on the MacConkey conductivity, total hardness, pH, iron level, and chromium
agar media by passing through 0.45 µm filter paper. The level, and biological parameters, such as MPN and SPC
samples were then incubated for 24 h, and bacteria were were measured accordingly (Table 1). The color of
counted after incubation. The isolation and counting Bagmati River water at the Pashupati site (B-1) was brown,
24
of the viable microorganisms in the water sample were while that of the Balkhu site (B-2) in Kathmandu Valley
determined using the SPC technique. Briefly, 9 mL of was black (Figure 2). Turbidity indicates the presence of
sterile distilled water was added to separate test tubes suspended solids, including both organic and inorganic
and 1 mL of sample water was added to the first test tube; substances, in the water. The turbidity was about 35.4
from the first test tube, 1 mL of water was transferred to nephelometric turbidity units (NTU) at B-1 and 26.4 at
the second test tube. The serial dilution was up to 10 B-2. The lower turbidity in the B-2 site validates the color
-9
mL. Thereafter, 0.1 mL of the 10 dilution series was of the water sample. The observed turbidity exceeded
-9
transferred to the center of the surface of the nutrient the World Health Organization’s (WHO) recommended
agar plates; hence, the colony-forming unit (CFU) limit value. The turbidity and color of the water suggested that
26
was 250 × 10 CFU/100 mL. The sample was evenly before the confluence of the tributaries, the river water
-12
spread using a sterile L-shaped glass spreader and consisted of soil particles, which increased turbidity.
incubated at 37ºC for 24 h. The CFU was calculated and However, after mixing with the tributaries, the soil
multiplied by the calculated dilution factor to determine particles disappeared, resulting in a transparent but black
the number of colonies in CFU/100 mL of the original color. The black color is attributed to the mixing of sewer
sample. 25 from either local sources or tributaries. 4,27
Volume 22 Issue 1 (2025) 44 doi: 10.36922/ajwep.8434