
Page 52 - AJWEP-v22i2
P. 52
Rudi, et al.
physiological effects, highlighting the need for accurate
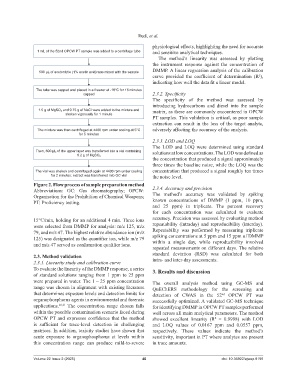
1 mL of the 52nd OPCW PT sample was added to a centrifuge tube and sensitive analytical techniques.
The method’s linearity was assessed by plotting
the instrument response against the concentration of
DMMP. A linear regression analysis of the calibration
500 µL of acetonitrile (1% acetic acid) was mixed with the sample
curve provided the coefficient of determination (R²),
indicating how well the data fit a linear model.
The tube was capped and placed in a freezer at -18°C for 15 minutes
capped 2.3.2. Specificity
The specificity of the method was assessed by
introducing hydrocarbons and diesel into the sample
1.5 g of MgSO and 0.75 g of NaCl were added to the mixture and matrix, as these are commonly encountered in OPCW
shaken vigorously for 1 minute
PT samples. This validation is critical, as poor sample
extraction can result in the loss of the target analyte,
The mixture was then centrifuged at 4400 rpm under cooling at 5°C adversely affecting the accuracy of the analysis.
for 5 minutes
2.3.3. LOD and LOQ
The LOD and LOQ were determined using standard
Then, 600 µL of the upper layer was transferred into a vial containing solutions at low concentrations. The LOD was defined as
0.2 g of MgSO
the concentration that produced a signal approximately
three times the baseline noise, while the LOQ was the
The vial was shaken and centrifuged again at 4400 rpm under cooling concentration that produced a signal roughly ten times
for 2 minutes; extract was transferred into GC vial the noise level.
Figure 2. Flow process of sample preparation method
Abbreviations: GC: Gas chromatography; OPCW: 2.3.4. Accuracy and precision
Organisation for the Prohibition of Chemical Weapons; The method’s accuracy was validated by spiking
PT: Proficiency testing. known concentrations of DMMP (1 ppm, 10 ppm,
and 25 ppm) in triplicate. The percent recovery
for each concentration was calculated to evaluate
15°C/min, holding for an additional 4 min. Three ions accuracy. Precision was assessed by evaluating method
were selected from DMMP for analysis: m/z 125, m/z repeatability (intraday) and reproducibility (interday).
79, and m/z 47. The highest relative abundance ion (m/z Repeatability was performed by measuring triplicate
125) was designated as the quantifier ion, while m/z 79 spiking concentrations at 5 ppm and 15 ppm of DMMP
and m/z 47 served as confirmation qualifier ions. within a single day, while reproducibility involved
repeated measurements on different days. The relative
2.3. Method validation standard deviation (RSD) was calculated for both
2.3.1. Linearity study and calibration curve intra- and inter-day assessments.
To evaluate the linearity of the DMMP response, a series 3. Results and discussion
of standard solutions ranging from 1 ppm to 25 ppm
were prepared in water. The 1 – 25 ppm concentration The overall analysis method using GC-MS and
range was chosen in alignment with existing literature QuEChERS methodology for the screening and
that determines exposure levels and detection limits for detection of CWAS in the 52 OPCW PT was
nd
organophosphorus agents in environmental and forensic successfully optimized. A validated GC-MS technique
applications. 20,21 The concentration range chosen falls for identifying DMMP in OPCW PT samples performed
within the possible contamination scenario faced during well across all main analytical parameters. The method
OPCW PT and expresses confidence that the method showed excellent linearity (R = 0.9998) with LOD
2
is sufficient for trace-level detection in challenging and LOQ values of 0.0167 ppm and 0.0557 ppm,
matrices. In addition, toxicity studies have shown that respectively. These values indicate the method’s
acute exposure to organophosphorus at levels within sensitivity, important in PT where analytes are present
this concentration range can produce mild-to-severe in trace amounts.
Volume 22 Issue 2 (2025) 46 doi: 10.36922/ajwep.8196