
Page 62 - AJWEP-v22i2
P. 62
Al-Tamimi, et al.
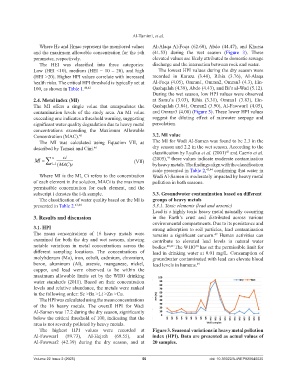
Where Hc and Hmac represent the monitored values Al-Alaqa Al-Foqa (62.60), Abdo (44.47), and Khursa
and the maximum allowable concentration for the i-th (41.53) during the wet season (Figure 3). These
parameter, respectively. elevated values are likely attributed to domestic sewage
The HEI was classified into three categories: discharge and the interaction between rock and water.
Low (HEI <10), medium (HEI = 10 – 20), and high The lowest HPI values during the dry season were
(HEI >20). Higher HPI values correlate with increased recorded in Karaza (3.40), Rihia (3.76), Al-Alaqa
health risks. The critical HPI threshold is typically set at Al-Foqa (4.05), Omran1, Omran2, Omran3 (4.3), Ein-
100, as shown in Table 1. 40,42 Qashqalah (4.39), Abdo (4.43), and Bi’r al-Wad (5.12).
During the wet season, low HPI values were observed
2.4. Metal index (MI) at Samu’a (3.03), Rihia (3.31), Omran1 (3.83), Ein-
The MI offers a single value that encapsulates the Qashqalah (3.84), Omran2 (3.90), Al-Fawwar1 (4.05),
contamination levels of the study area. An MI value and Omran3 (4.08) (Figure 3). These lower HPI values
exceeding one indicates a threshold warning, suggesting suggest the diluting effect of rainwater seepage and
significant water quality degradation due to heavy metal percolation.
concentrations exceeding the Maximum Allowable
Concentration (MAC). 45 3.2. MI value
The MI was calculated using Equation VII, as The MI for Wadi Al-Samen was found to be 2.3 in the
described by Tamasi and Cini. 46 dry season and 2.2 in the wet season. According to the
classification by Lyulko et al. (2001) and Caerio et al.
43
ci
n
44
MI i1 ( MACi) (VII) (2005), these values indicate moderate contamination
by heavy metals. The findings align with the classification
scale presented in Table 2, 43,44 confirming that water in
Where MI is the MI, Ci refers to the concentration Wadi Al-Samen is moderately impacted by heavy metal
of each element in the solution, MACi is the maximum pollution in both seasons.
permissible concentration for each element, and the
subscript i denotes the i-th sample. 3.3. Groundwater contamination based on different
The classification of water quality based on the MI is groups of heavy metals
presented in Table 2. 43,44 3.3.1. Toxic elements (lead and arsenic)
Lead is a highly toxic heavy metal naturally occurring
3. Results and discussion in the Earth’s crust and distributed across various
environmental compartments. Due to its persistence and
3.1. HPI strong adsorption to soil particles, lead contamination
The mean concentrations of 16 heavy metals were remains a significant concern. Human activities can
47
examined for both the dry and wet seasons, showing contribute to elevated lead levels in natural water
notable variations in metal concentrations across the bodies. 48,49 The WHO has set the permissible limit for
50
different sampling locations. The concentrations of lead in drinking water at 0.01 mg/L. Consumption of
molybdenum (Mo), iron, cobalt, cadmium, chromium, groundwater contaminated with lead can elevate blood
boron, aluminum (Al), arsenic, manganese, nickel, lead levels in humans. 49
copper, and lead were observed to be within the
maximum allowable limits set by the WHO drinking
water standards (2011). Based on their concentration
levels and relative abundance, the metals were ranked
in the following order: Se >Ba >Li >Zn >Cu.
The HPI was calculated using the mean concentrations
of the 16 heavy metals. The overall HPI for Wadi
Al-Samen was 17.2 during the dry season, significantly
below the critical threshold of 100, indicating that the
area is not severely polluted by heavy metals.
The highest HPI values were recorded at Figure 3. Seasonal variations in heavy metal pollution
Al-Fawwar1 (89.73), Al-Hejreh (69.55), and index (HPI). Data are presented as actual values of
Al-Fawwar2 (42.39) during the dry season, and at 20 samples.
Volume 22 Issue 2 (2025) 56 doi: 10.36922/AJWEP025040020