
Page 70 - AN-2-1
P. 70
Advanced Neurology Alpha-synuclein, depression and neurodegeneration
disorders as a whole) was significantly and positively rs3775439) showed significant correlations with the
correlated with the prevalence of both PD and AlzD estimated prevalence of depressive disorders at both time
at both time points, even after correction for multiple points. The rs2736990 and rs3775439 allele frequencies
comparisons. The magnitude of these correlations were significantly correlated with the prevalence of both
was somewhat greater in 1990 (r = 0.38 – 0.61) than PD and AlzD. After correcting for possible confounding
in 2019 (r = 0.19 – 0.47) and appeared to be slightly factors (life expectancy, air pollution, and pesticide
greater for dysthymia (r = 0.35 – 0.62) than for major exposure), only the rs3775439 allele frequency distribution
depression (r = 0.19 – 0.38). When these associations remained significantly and negatively correlated with the
were adjusted for life expectancy (in 1990 and 2019) prevalence of depression and PD (at both time points) as
and environmental risk factors (in 2019), their strength well as AlzD (in 1990). This suggests that the distribution
was somewhat attenuated (r = 0.16 – 0.59), but they of the rs3775439 (A) allele across populations may be
remained statistically significant. This suggests that the associated with a lower prevalence of the aforementioned
link between these disorders cannot be entirely ascribed disorders.
to shared environmental risk factors. To examine the possibility that the above association
3.2. Cross-lagged regression analysis of depression, might be mediated by depression, partial correlation
PD, and AlzD analyses of the associations between each allele frequency
and both PD and AlzD were carried out, while adjusting
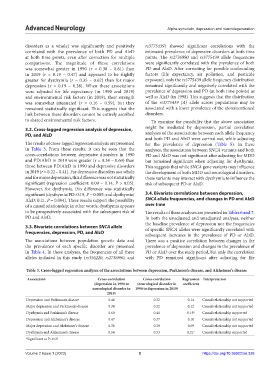
The results of cross-lagged regression analysis are presented for the prevalence of depression (Table 5). In these
in Table 3. From these results, it can be seen that the analyses, the association between SNCA variants and both
cross-correlations between depressive disorders in 1990 PD and AlzD was not significant after adjusting for MDD
and PD/AlzD in 2019 were greater (r = 0.34 – 0.60) than but remained significant when adjusting for dysthymia.
those between PD/AlzD in 1990 and depressive disorders This suggests that while SNCA gene variants may influence
in 2019 (r = 0.22 – 0.41). For depressive disorders as a whole the development of both MDD and neurological disorders,
and for major depression, this difference was not statistically these variants may interact with dysthymia to influence the
significant (regression coefficient: 0.09 – 0.14, P > 0.05). risk of subsequent PD or AlzD.
However, for dysthymia, this difference was statistically
significant (dysthymia/PD: 0.19, P = 0.005; and dysthymia/ 3.4. Bivariate correlations between depression,
AlzD: 0.21, P = 0.004). These results support the possibility SNCA allele frequencies, and changes in PD and AlzD
of a causal relationship; in other words, dysthymia appears over time
to be prospectively associated with the subsequent risk of The results of these analyses are presented in Tables 6 and 7.
PD and AlzD. In both the unadjusted and unadjusted analyses, neither
the baseline prevalence of depression nor the frequencies
3.3. Bivariate correlations between SNCA allele of specific SNCA alleles were significantly correlated with
frequencies, depression, PD, and AlzD
subsequent increases in the prevalence of PD or AlzD.
The associations between population genetic data and There was a positive correlation between changes in the
the prevalence of each specific disorder are presented prevalence of depression and changes in the prevalence of
in Table 4. In these analyses, the frequencies of all three PD or AlzD over the study period, but only the correlation
alleles included in this study (rs356220, rs2736990, and with PD remained significant after adjusting for life
Table 3. Cross‑lagged regression analyses of the associations between depression, Parkinson’s disease, and Alzheimer’s disease
Association Cross‑correlation Cross‑correlation Regression Interpretation
(depression in 1990 to (neurological disorder in coefficient
neurological disorder in 1990 to depression in 2019)
2019)
Depression and Parkinson’s disease 0.46 0.32 0.14 Causal relationship not supported
Major depression and Parkinson’s disease 0.34 0.22 0.12 Causal relationship not supported
Dysthymia and Parkinson’s disease 0.60 0.41 0.19 a Causal relationship supported
Depression and Alzheimer’s disease 0.47 0.37 0.10 Causal relationship not supported
Major depression and Alzheimer’s disease 0.38 0.29 0.09 Causal relationship not supported
Dysthymia and Alzheimer’s disease 0.54 0.33 0.21 a Causal relationship supported
a Significant at P<0.05
Volume 2 Issue 1 (2023) 5 https://doi.org/10.36922/an.326