
Page 75 - AN-2-3
P. 75
Advanced Neurology Sleep and lifestyle factors in young adults with childhood TBI
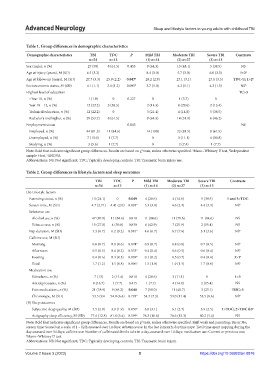
Table 1. Group differences in demographic characteristics
Demographic characteristics TBI TDC P Mild TBI Moderate TBI Severe TBI Contrasts
n=54 n=13 (1) n=14 (2) n=27 (3) n=13
Sex (male), n (%) 27 (50) 8 (61.5) 0.455 9 (64.3) 13 (48.1) 5 (38.5) NS
Age at injury (years), M (SD) 6.5 (3.2) - - 8.4 (3.0) 5.7 (3.0) 6.0 (3.3) 1>2 c
Age at follow-up (years), M (SD) 27.7 (3.3) 25.9 (2.2) 0.047 a 29.2 (2.9) 27.1 (3.1) 27.1 (3.5) TDC<1; 1>2 a
Socioeconomic status, M (SD) 4.1 (1.1) 3.4 (1.2) 0.095 b 3.7 (1.0) 4.2 (1.1) 4.2 (1.3) NS b
Highest level of education TC>3
<Year 10, n (%) 1 (1.9) 0 0.227 0 1 (3.7) 0
Year 10 – 12, n (%) 12 (22.2) 5 (38.5) 2 (14.3) 8 (29.6) 2 (15.4)
Technical education, n (%) 12 (22.2) 0 3 (21.4) 4 (14.8) 5 (38.5)
Bachelor’s and higher, n (%) 29 (53.7) 8 (61.5) 9 (64.3) 14 (51.9) 6 (46.2)
Employment status 0.845 NS
Employed, n (%) 44 (81.5) 11 (84.6) 14 (100) 22 (81.5) 8 (61.5)
Unemployed, n (%) 7 (13.0) 1 (7.7) 0 3 (11.1) 4 (30.8)
Studying, n (%) 3 (5.6) 1 (7.7) 0 2 (7.4) 1 (7.7)
Note: Bold font indicates significant group differences. Results are based on χ tests, unless otherwise specified. Mann–Whitney U test, Independent
a
b
2
sample t‑test, ANOVA.
c
Abbreviations: NS: Not significant; TDC: Typically developing controls; TBI: Traumatic brain injury use.
Table 2. Group differences in lifestyle factors and sleep outcomes
TBI TDC P Mild TBI Moderate TBI Severe TBI Contrasts
n=54 n=13 (1) n=14 (2) n=27 (3) n=13
(A) Lifestyle factors
Parenting status, n (%) 13 (24.1) 0 0.049 4 (28.6) 4 (14.8) 5 (38.5) 1 and 3>TDC
Screen time, M (SD) 4.7 (2.71) 4.41 (2.0) 0.893 a 5.3 (3.0) 4.6 (2.3) 4.4 (3.3) NS a
Substance use
Alcohol use, n (%) 47 (87.0) 11 (84.6) 0.818 11 (84.6) 11 (78.6) 11 (84.6) NS
Tobacco use, n (%) 15 (27.8) 4 (30.8) 0.830 6 (42.9) 7 (25.9) 2 (15.4) NS
Nap duration, M (SD) 5.3 (6.7) 6.2 (9.2) 0.981 a 4.6 (6.7) 6.7 (7.6) 3.1 (3.6) NS a
Caffeine use, M (SD)
Morning 0.8 (0.7) 0.8 (0.6) 0.874 a 0.9 (0.7) 0.8 (0.8) 0.7 (0.5) NS a
Afternoon 0.5 (0.5) 0.4 (0.2) 0.353 a 0.4 (0.4) 0.6 (0.5) 0.6 (0.4) NS a
Evening 0.4 (0.6) 0.3 (0.5) 0.839 a 0.1 (0.2) 0.5 (0.7) 0.4 (0.4) 3>1 a
Total 1.7 (1.2) 1.5 (0.8) 0.806 a 1.5 (1.0) 1.9 (1.5) 1.7 (0.9) NS a
Medication use
Stimulants, n (%) 7 (13) 2 (15.4) 0.818 4 (28.6) 3 (11.1) 0 1>3
Antidepressants, n (%) 9 (16.7) 1 (7.7) 0.415 1 (7.7) 4 (14.8) 2 (15.4) NS
Pain medications, n (%) 21 (38.9) 9 (69.2) 0.048 7 (50.0) 11 (40.7) 3 (23.1) TDC>3
Chronotype, M (SD) 53.5 (9.6 54.0 (6.4) 0.793 a 54.3 (7.3) 53.0 (11.4) 53.5 (8.6) NS a
(B) Sleep outcomes
Subjective sleep quality, M (SD) 5.5 (2.9) 3.9 (1.9) 0.050 a 6.0 (3.1) 6.1 (2.7) 3.9 (2.5) 1>TDC; 2>TDC &3 a
Actigraphy sleep efficiency, M (SD) 77.4 (12.8) 81.0 (5.4) 0.599 a 76.3 (16.8) 76.6 (13.3) 80.2 (5.4) NS
2
Note: Bold font indicates significant group differences. Results are based on χ tests, unless otherwise specified. Shift work and parenting: Yes or No;
screen time: Scored on a scale of 1 – 12 h assessed over 14 days; substance use: In the last 2 month; daytime naps: Total time spent napping during the
day assessed over 14 days; caffeine use: Number of caffeinated drinks take in a day, assessed over 14 days; medication use: Current or previous use;
a Mann–Whitney U test.
Abbreviations: NS: Not significant; TDC: Typically developing controls; TBI: Traumatic brain injury.
Volume 2 Issue 3 (2023) 5 https://doi.org/10.36922/an.0876