
Page 76 - AN-2-3
P. 76
Advanced Neurology Sleep and lifestyle factors in young adults with childhood TBI
while controlling for the effect of age at follow-up in the TBI quality (P = 0.037). No significant relationships were
group, are presented in Table 3. The overall model assessing identified between objective sleep efficiency and lifestyle
the lifestyle factors associated with poor subjective sleep factors.
quality was significant (P < 0.001), and two significant
correlates were identified: Evening chronotype (P < 0.001) 4. Discussion
and use of tobacco in the past 2 months (P < 0.001). The This study explored the relationships between sleep
model for objective sleep efficiency did not show a good (subjective and objective) and lifestyle factors in a sample
fit (P = 0.814); however, being a parent was associated of young adults who sustained TBI in childhood. In partial
with poor objective sleep efficacy (P = 0.038). When support of our hypothesis, subjective and objective sleep
these analyses were repeated in just the TBI participants outcomes were predicted by some lifestyle factors in young
who reported poor subjective (39%) and objective (67%) adults with childhood TBI. Poor subjective sleep quality
outcomes, tobacco use in the past 2 months again emerged was significantly associated with evening chronotype and
as the only significant predictor (P = 0.002) of poor subject use of tobacco in the past 2 months, while being a parent
sleep quality, while being a parent (P < 0.001) and alcohol and alcohol use in the past 2 months were associated with
use in the past 2 months (P = 0.035) were associated with poor objective sleep efficiency. These findings provide
poor objective sleep efficiency. Figure 1 illustrates these preliminary insights into the relationships between
findings. sleep and lifestyle factors in young adulthood following
childhood TBI.
3.4. Relationships between sleep outcomes and Poorer subjective sleep quality was significantly
lifestyle factors in the TDC group
associated with evening chronotype (i.e., a preference for
Results presented in Table S1 show a significant relationship later timing of sleep and wake) in the whole TBI group, but
only between morning chronotype and subjective sleep not in the TBI subgroup presenting with poor subjective
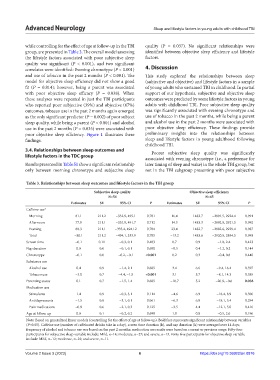
Table 3. Relationships between sleep outcomes and lifestyle factors in the TBI group
Subjective sleep quality Objective sleep efficiency
N=54 N=45
Estimates SE 95% CI P Estimates SE 95% CI P
Caffeine use †
Morning 81.1 211.2 −332.9, 495.1 0.701 16.4 1483.7 −2891.5, 2924.4 0.991
Afternoon 77.9 211.1 −335.9, 491.7 0.712 14.3 1483.3 −2892.8, 2921.5 0.992
Evening 80.3 211.1 −333.4, 494.12 0.704 23.4 1482.7 −2882.6, 2929.4 0.987
Total −80.1 211.2 −494.1, 333.9 0.705 −13.2 1483.6 −2920.8, 2894.5 0.993
Screen time −0.1 0.11 −0.3, 0.1 0.403 0.7 0.9 −1.0, 2.4 0.423
Nap duration 0.0 0.0 −0.1, 0.1 0.600 −0.5 0.4 −1.2, 0.2 0.144
Chronotype −0.1 0.0 −0.2, −0.1 <0.001 0.2 0.3 −0.4, 0.8 0.440
Substance use
Alcohol use 0.4 0.9 −1.4, 2.1 0.685 3.4 6.6 −9.4, 16.4 0.597
Tobacco use −3.0 0.7 −4.4, −1.5 <0.001 3.1 5.7 −8.1, 14.3 0.585
Parenting status 0.1 0.7 −1.5, 1.4 0.685 −10.7 5.2 −20.9, −0.6 0.038
Medication use
Stimulants 1.4 0.9 −0.3, 3.1 0.114 −4.6 6.9 −18.4, 8.9 0.506
Antidepressants −1.5 0.8 −3.1, 0.1 0.061 −6.3 6.0 −18.1, 5.4 0.294
Pain medications −0.9 0.6 −2.1, 0.3 0.125 −3.5 4.4 −12.1, 5.0 0.416
Age at follow-up 0.0 0.1 −0.2, 0.2 0.699 1.0 0.8 −0.5, 2.6 0.196
Note: Based on generalized linear models (controlling for the effect of age at follow-up). Bold face represents significant relationship between variables
(P<0.05). Caffeine use (number of caffeinated drinks take in a day), screen time duration (h), and nap duration (h) were averaged over 14 days;
frequency of alcohol and tobacco use was based on the past 2 months; medication use results were based on current or previous usage. Fifty-four
participants for subjective sleep variable include: Mild, n=14; moderate, n=27; and severe, n=13. Forty-five participants for objective sleep variable
include: Mild, n=12; moderate, n=22; and severe, n=11.
Volume 2 Issue 3 (2023) 6 https://doi.org/10.36922/an.0876