
Page 111 - AN-3-4
P. 111
Advanced Neurology Stress accelerates parkinsonism in rats
to a Waters Quattro Micro Mass Spectrometer (liquid
chromatography/tandem mass spectrometry system).
Sample separation was performed using a Phenomenex
Kinetex column (50 mm × 2.1 mm × 2.7 μm). A six-
point (10, 25, 50, 100, 250, 500, and 1000 ng/mL) curve
for CORT concentration (Sigma-Aldrich) was used as the
standard in the analysis of the samples. The analysis was
performed using MassLynx software. The procedure was
performed as described previously. 39
2.8. Data analysis
Data were tested for homogeneity of variance using Levene’s
test and for normality using the Kolmogorov–Smirnov test.
Thus, all data were analyzed using parametric methods. In
Experiment I, CORT levels were analyzed using a one-way
analysis of variance (ANOVA), considering the duration of
UMS (1, 2, or 3 weeks) as the main factor. In Experiment
II, catalepsy and open field test data were analyzed using
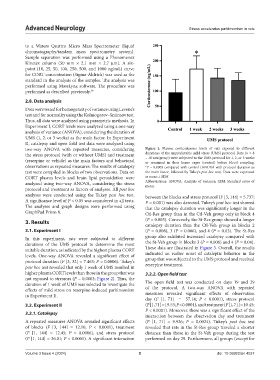
two-way ANOVA with repeated measures, considering Figure 2. Plasma corticosterone levels of rats exposed to different
the stress protocol (with or without UMS) and treatment durations of the unpredictable mild stress (UMS) protocol. Rats (n = 8
(reserpine or vehicle) as the main factors and behavioral – 10 rats/group) were subjected to the UMS protocol for 1, 2, or 3 weeks
or remained in their home cages (control) before blood sampling.
observations as repeated measures. The results of catalepsy *P = 0.0003 compared with control (ANOVA with protocol duration as
test were compiled in blocks of two observations. Data on the main factor, followed by Tukey’s post hoc test). Data were expressed
CORT plasma levels and brain lipid peroxidation were as mean ± SEM
analyzed using two-way ANOVA, considering the stress Abbreviations: ANOVA: Analysis of variance; SEM: Standard error of
mean.
protocol and treatment as factors of analyses. All post hoc
analyses were conducted using the Tukey post hoc test. between the blocks and stress protocol (F [3, 144] = 5.737;
A significance level of P < 0.05 was considered in all tests. P = 0.001) was also detected. Tukey’s post hoc test showed
The analyses and graph designs were performed using that the catalepsy duration was significantly longer in the
GraphPad Prism 8. Ctl-Res group than in the Ctl-Veh group only in block 4
3. Results (P = 0.003). Conversely, the St-Res group showed a longer
catalepsy duration than the Ctl-Veh group in blocks 2
3.1. Experiment I (P = 0.008), 3 (P = 0.006), and 4 (P = 0.03). The St-Res
In this experiment, rats were subjected to different group also exhibited increased catalepsy compared with
durations of the UMS protocol to determine the most the St-Veh group in blocks 3 (P = 0.006) and 4 (P = 0.04).
suitable duration, as indicated by the highest plasma CORT These data are illustrated in Figure 3. Overall, the results
levels. One-way ANOVA revealed a significant effect of indicated an earlier onset of cataleptic behavior in the
protocol duration (F [3, 32] = 7.463; P = 0.0006). Tukey’s group that was subjected to the UMS protocol and received
post hoc test revealed that only 1 week of UMS resulted in reserpine treatment.
higher plasma CORT levels than those in the group that was 3.2.2. Open field test
not exposed to stressors (P = 0.0003; Figure 2). Thus, the
duration of 1 week of UMS was selected to investigate the The open field test was conducted on days 19 and 29
effects of mild stress on reserpine-induced parkinsonism of the protocol. A two-way ANOVA with repeated
in Experiment II. measures revealed significant effects of observation
day (F [1, 71] = 57.14; P < 0.0001), stress protocol
3.2. Experiment II (F [1, 71] = 19.53; P < 0.0001), and treatment (F [1, 71] = 10.45;
P < 0.0001). Moreover, there was a significant effect of the
3.2.1. Catalepsy
interaction between the observation day and treatment
A repeated measures ANOVA revealed significant effects (F [1, 71] = 9.926; P = 0.0024). Tukey’s post hoc test
of blocks (F [3, 144] = 12.10, P < 0.0001), treatment revealed that rats in the St-Res group traveled a shorter
(F [1, 144] = 12.45; P = 0.0006), and stress protocol distance than those in the St-Veh group during the test
(F [1, 144] = 36.01; P < 0.0001). A significant interaction performed on day 29. Furthermore, all groups (except for
Volume 3 Issue 4 (2024) 5 doi: 10.36922/an.4037