
Page 86 - ARNM-3-2
P. 86
Advances in Radiotherapy
& Nuclear Medicine Radiotherapy in node-positive bladder cancer
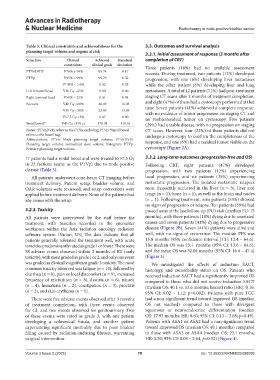
Table 3. Clinical constraints and achieved doses for the 3.3. Outcomes and survival analysis
planning target volume and organs at risk
3.3.1. Initial assessment of response (3 months after
Structure Clinical Achieved Standard completion of CRT)
constraints clinical goals deviation
Three patients (18%) had no available assessment
PTVnDVH a V76% > 99% 99.74 0.17 records. During treatment, two patients (12%) developed
PTVp V95% > 99% 99.79 0.32 progression, with one (6%) developing liver metastases
V105% < 2.0% 0.02 0.03 while the other patient (6%) developing liver and lung
Left femoral head V50 Gy <25% 0.00 0.00 metastases. A total of 12 patients (71%) had post-treatment
Right femoral head V50% < 25% 0.01 0.04 staging CT scans after 3 months of treatment completion,
Rectum V40 Gy <60% 46.49 16.08 and eight (47%) of them had a cystoscopy performed at that
V50 Gy <50% 23.00 13.98 time. Seven patients (41%) achieved a complete response,
with no evidence of tumor progression on staging CT and
V57.5 Gy <5% 6.47 8.80
no visible/residual tumor on cystoscopy. Five patients
Small bowel b V45 Gy <195 cc 378.01 118.16 (29%) had a stable disease, with no progression on staging
Notes: PTVnDVH refers to the PTVn excluding PTVp; Small bowel CT scans. However, four (23%) of these patients did not
b
a
refers to the bowel bag. undergo a cystoscopy to confirm the completeness of the
Abbreviations: PTVn: Node planning target volume; PTVnDVH: response, and one (6%) had a residual tumor visible on the
Planning target volume normalized dose volume histogram; PTVp:
Primary planning target volume. cystoscopy (Figure 2A).
17 patients had a nodal boost and were treated to 57.5 Gy 3.3.2. Long-term outcomes (progression-free and OS)
in 23 factions (same as the PTVp) due to node-positive Following CRT, eight patients (47%) developed
disease (Table 3). progression, with two patients (12%) experiencing
All patients underwent cone-beam CT imaging before local progression, and six patients (35%) experiencing
treatment delivery. Patient setup, bladder volume, and metastatic progression. The isolated metastatic relapses
OAR volumes were reviewed, and setup corrections were most frequently occurred in the liver (n = 3), liver and
applied before treatment delivery. None of the patients had lungs (n = 1), bone (n = 1), as well as the brain and nodes
any issues with the setup. (n = 1). Following treatment, nine patients (53%) showed
no signs of progression or relapse. Ten patients (59%) had
3.2.3. Toxicity passed away at the last follow-up (FU) visit (median FU: 15
All patients were interviewed by the staff before the months), with three patients (18%) dying due to unrelated
treatment, with toxicities recorded in the encounter causes and seven patients (41%) dying due to progressive
workspace within the Aria radiation oncology radiation disease (Figure 2B). Seven (41%) patients were alive and
software system (Varian, US) The data indicate that all well, with no signs of recurrence. The median PFS was
patients generally tolerated the treatment well, with acute 15.8 months (95% confidence interval [CI]: 12.4 – 64.6).
toxicities predominantly rated as grade 1 or lower. There were The median OS was 23.1 months (95% CI: 13.6 – 64.6),
58 adverse events observed within 3 months of RT (early and the mean OS was 32.04 months (95% CI: 16.6 – 47.4)
toxicity), with most graded as grade 1 or 2, and only one event (Figure 3).
was graded as clinically significant grade 3 toxicity. The most We investigated the effects of induction SACT,
common toxicity observed was fatigue (n = 14), followed by histology, and comorbidity status on OS. Patients who
diarrhea (n = 9), pain or local discomfort (n = 9), increased received induction SACT had a significantly improved OS
frequency of micturition (n = 8), dysuria (n = 6), nausea compared to those who did not receive induction SACT
(n = 4), hematuria (n = 2), constipation (n = 3), proctitis (median OS: 40.1 vs. 13.6 months; hazard ratio [HR]: 0.16;
(n = 2), and skin erythema (n = 1). 95% CI: 0.02 – 1.12; p=0.002). Patients with pure TCC
There were five adverse events observed after 3 months had a non-significant trend toward improved OS (median
of treatment completion, with three events observed OS not reached) compared to those with divergent
for GI, and two events observed for genitourinary. Two squamous or neuroendocrine differentiation (median
of these events were rated as grade 3, with one patient OS: 17.93 months; HR: 0.60; 95% CI: 0.13 – 2.68; p=0.49).
developing a colovesical fistula, and another patient Patients with ASA1 or ASA2 had a non-significant trend
experiencing significant morbidity due to poor bladder toward improved OS (median OS: 40.1 months) compared
filling caused by radiation-inducing fibrosis, warranting to those with ASA3 or ASA4 (median OS: 23.1 months;
surgical intervention. HR: 0.50; 95% CI: 0.09 – 2.64, p=0.32) (Figure 4).
Volume 3 Issue 2 (2025) 78 doi: 10.36922/ARNM025090009