
Page 42 - BH-2-1
P. 42
Brain & Heart Practical tips for AD and PD
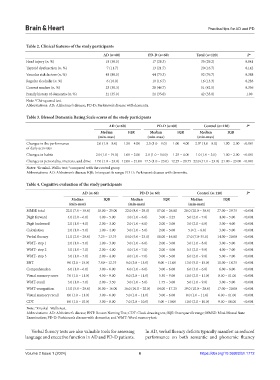
Table 2. Clinical features of the study participants
AD (n=60) PD‑D (n=60) Total (n=120) P a
Head injury (n, %) 18 (30.0) 17 (28.3) 35 (29.2) 0.841
Thyroid dysfunction (n, %) 7 (11.7) 13 (21.7) 20 (16.7) 0.142
Vascular risk factors (n, %) 48 (80.0) 44 (73.3) 92 (76.7) 0.388
Regular alcoholic (n, %) 6 (10.0) 10 (16.7) 16 (13.3) 0.283
Current smoker (n, %) 23 (38.3) 28 (46.7) 51 (42.5) 0.356
Family history of dementia (n, %) 21 (35.0) 21 (35.0) 42 (35.0) 1.00
Note: Chi-squared test.
a
Abbreviations: AD: Alzheimer’s disease; PD-D: Parkinson’s disease with dementia
Table 3. Blessed Dementia Rating Scale scores of the study participants
AD (n=60) PD‑D (n=60) Control (n=120) P a
Median IQR Median IQR Median IQR
(min‑max) (min‑max) (min‑max)
Changes in the performance 2.0 (1.0 – 8.0) 1.50 – 4.00 2.5 (1.0 – 9.0) 1.00 – 4.00 2.0* (1.0 – 8.0) 1.00 – 2.00 <0.001
of daily activities
Changes in habits 2.0 (1.0 – 19.0) 1.00 – 2.00 2.0 (1.0 – 14.0) 1.25 – 4.00 1.0 (1.0 – 3.0) 1.00 – 2.00 <0.001
Changes in personality, interests, and drive 17.0 (1.0 – 23.0) 12.00 – 21.00 17.5 (1.0 – 23.0) 12.25 – 20.75 22.0 (11.0 – 23.0) 21.00 – 23.00 <0.001
Notes: Kruskal–Wallis test; *compared with the control group
a
Abbreviations: AD: Alzheimer’s disease; IQR: Interquartile range; PD-D: Parkinson’s disease with dementia.
Table 4. Cognitive evaluation of the study participants
AD (n: 60) PD‑D (n: 60) Control (n: 120) P a
Median IQR Median IQR Median IQR
(min‑max) (min‑max) (min‑max)
MMSE total 22.0 (7.0 – 30.0) 18.00 – 25.00 22.0 (8.0 – 29.0) 17.00 – 26.00 28.0 (20.0 – 30.0) 27.00 – 29.75 <0.001
Digit forward 4.0 (2.0 – 6.0) 4.00 – 5.00 4.0 (1.0 – 6.0) 3.00 – 4.25 5.0 (2.0 – 7.0) 4.00 – 5.00 <0.001
Digit backward 2.0 (1.0 – 4.0) 2.00 – 3.00 2.0 (1.0 – 6.0) 2.00 – 3.00 3.0 (2.0 – 6.0) 3.00 – 4.00 <0.001
Calculation 2.0 (1.0 – 5.0) 1.00 – 4.00 3.0 (1.0 – 5.0) 2.00 – 5.00 5.0 (1 – 6.0) 3.00 – 5.00 <0.001
Verbal fluency 11.0 (2.0 – 20.0) 7.25 – 13.75 14.0 (5.0 – 23.0) 10.00 – 16.00 17.0 (7.0-35.0) 14.00 – 20.00 <0.001
WMT- step 1 2.0 (1.0 – 5.0) 1.00 – 3.00 3.0 (1.0 – 6.0) 2.00 – 3.00 3.0 (1.0 – 8.0) 3.00 – 5.00 <0.001
WMT- step 2 3.0 (1.0 – 7.0) 2.00 – 4.00 4.0 (1.0 – 7.0) 2.00 – 4.00 5.5 (2.0 – 9.0) 4.00 – 7.00 <0.001
WMT- step 3 3.0 (1.0 – 7.0) 2.00 – 4.00 4.0 (1.0 – 7.0) 3.00 – 5.00 6.0 (2.0 – 9.0) 5.00 – 7.00 <0.001
BNT 9.0 (2.0 – 15.0) 7.00 – 12.75 9.0 (3.0 – 15.0) 8.00 – 11.00 13.0 (5.0 – 15.0) 11.00 – 14.75 <0.001
Comprehension 6.0 (1.0 – 6.0) 3.00 – 6.00 6.0 (1.0 – 6.0) 3.00 – 6.00 6.0 (3.0 – 6.0) 6.00 – 6.00 <0.001
Visual memory score 7.0 (1.0 – 11.0) 4.50 – 9.00 8.0 (2.0 – 11.0) 5.50 – 9.00 10.0 (2.0 – 11.0) 8.00 – 11.00 <0.001
WMT-recall 3.0 (1.0 – 7.0) 2.00 – 3.50 3.0 (1.0 – 5.0) 1.75 – 3.00 5.0 (1.0 – 9.0) 3.00 – 5.00 <0.001
WMT-recognition 13.0 (5.0 – 20.0) 10.00 – 16.00 16.0 (10.0 – 20.0) 14.00 – 17.25 19.0 (10.0 – 20.0) 17.00 – 20.00 <0.001
Visual memory recall 4.0 (1.0 – 11.0) 3.00 – 6.00 5.0 (1.0 – 11.0) 3.00 – 6.00 8.0 (1.0 – 11.0) 6.00 – 11.00 <0.001
CDT 6.0 (1.0 – 10.0) 3.00 – 8.00 7.0 (2.0 – 10.0) 5.00 – 10.00 10.0 (2.0 – 10.0) 9.00 – 10.00 <0.001
a
Note: Kruskal–Wallis test.
Abbreviations: AD: Alzheimer’s disease; BNT: Boston Naming Test; CDT: Clock drawing test; IQR: Interquartile range; MMSE: Mini-Mental State
Examination; PD-D: Parkinson’s disease with dementia; and WMT: Word memory test.
Verbal fluency tests are also valuable tools for assessing In AD, verbal fluency deficits typically manifest as reduced
language and executive function in AD and PD-D patients. performance on both semantic and phonemic fluency
Volume 2 Issue 1 (2024) 6 https://doi.org/10.36922/bh.1712