
Page 82 - BH-3-1
P. 82
Brain & Heart Bovine pericardial patching in CEA
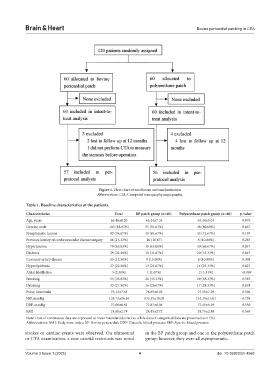
Figure 1. Flow chart of enrollment and randomization
Abbreviation: CTA: Computed tomography angiography.
Table 1. Baseline characteristics of the patients
Characteristics Total BP patch group (n=60) Polyurethane patch group (n=60) p‑value
Age, years 65.46±8.20 65.44±7.35 65.48±9.03 0.979
Gender, male 103 (85.83%) 55 (91.67%) 48 (80.00%) 0.067
Symptomatic lesions 92 (76.67%) 49 (81.67%) 43 (71.67%) 0.195
Previous history of cerebrovascular disease surgery 16 (13.33%) 10 (16.67) 6 (10.00%) 0.283
Hypertension 79 (65.83%) 39 (65.00%) 40 (66.67%) 0.847
Diabetes 39 (32.50%) 19 (31.67%) 20 (33.33%) 0.845
Coronary artery disease 15 (12.50%) 9 (15.00%) 6 (10.00%) 0.408
Hyperlipidemia 27 (22.50%) 13 (21.67%) 14 (23.33%) 0.827
Atrial fibrillation 3 (2.50%) 1 (1.67%) 2 (3.33%) >0.999
Smoking 55 (45.83%) 26 (43.33%) 29 (48.33%) 0.583
Drinking 33 (27.50%) 16 (26.67%) 17 (28.33%) 0.838
Pulse, beats/min 75.12±7.65 74.65±8.02 75.58±7.29 0.506
SBP, mmHg 133.72±16.56 133.25±18.09 134.18±15.01 0.759
DBP, mmHg 77.66±8.85 77.87±8.56 77.45±9.19 0.550
BMI 24.60±2.79 24.45±2.72 24.75±2.88 0.569
Note: Data of continuous data are expressed as mean±standard deviation, while data of categorical data are presented as n (%).
Abbreviations: BMI: Body mass index; BP: Bovine pericardial; DBP: Diastolic blood pressure; SBP: Systolic blood pressure.
strokes or cardiac events were observed. On ultrasound in the BP patch group and one in the polyurethane patch
or CTA examination, a new carotid restenosis was noted group; however, they were all asymptomatic.
Volume 3 Issue 1 (2025) 4 doi: 10.36922/bh.4568