
Page 55 - EER-2-1
P. 55
Explora: Environment
and Resource Statistical analysis of climate time series
Appendix hemisphere. Likewise on the other hemisphere with
related proportions. This phenomenon therefore certainly
Table A1 summarizes the average lengths of strings of compensates for a large part of the summer increase
0 and 1 per semester for the UOS. in stratification present in the temperate zones of the
We notice the behavior of the very pronounced hemisphere where the ITCZ is temporarily positioned.
Markov-1 lengthening type. Modeled by the binomial If there were no other influences, the signal would be of
law with parameters n = 137 and P = 0.5, such a situation binomial Markov-0 type or close to it. However, it is clearly
would be very improbable (<1 chance in a hundred). of the Markov-1 lengthening type. Hence, there is still at
least one important additional influence which intervenes
How to explain the rather Markov-1 lengthening type
behavior for the half-yearly UOS stratification data? in the half-yearly evolution of the stratification of the UOS.
As we show below, using the statistics for El Niño and La
Here is our detailed response to this question: Niña events obtained with the ONI index indicates that the
Sallée et al. clearly indicate the summer-winter
1
seasonal alternation which concerns the stratification of “lengthening” character of the semiannual signal certainly
the UOS. Notably because in temperate and cold zones, comes largely from this influence. The ONI index used is
there is in the 0 –200 m layer the presence of a seasonal an index provided by NOAA and downloadable from the
thermocline in summer reinforced in particular by the following link: https://origin.cpc.ncep.noaa.gov/products/
2
melting of the ice and which breaks down in winter. analysis_monitoring/ensostuff/ONI_v5.php
3
Note that summer (winter) refers to August-October in The drastic rules applied to it to obtain it and the large
the northern (southern) hemisphere and January-March geographical area over which it is calculated (5N-5S,
in the southern (northern) hemisphere. Moreover, the 170W-120W) make it, in our opinion, the El Niño-
significant imbalance in the land-sea relationship between Southern Oscillation (ENSO) index best suited for our
4
the two hemispheres (80% of the surface area of the study among those that exist (cf. Trenberth ).
southern hemisphere is marine compared to only 60% According to him, over the 74 years of the period
of the northern hemisphere) means that there is no full 1950 – 2023, the cumulative equivalent of approximately
compensation of the average stratification of that of the 21 years was affected by El Niño, that of approximately
south by that of the north. Hence, if it was only this aspect 22 years by La Niña and that of approximately 33 years
that intervened, we should observe a half-yearly signal is “normal,” that is to say neither affected by El Niño nor
of the Markov-1 alternating type. However, it is of the affected by La Niña. Still according to this index, the average
Markov-1 lengthening type. duration is about 9 months (more precisely 8.65) per El
So necessarily, other phenomena intervene in the Niño event, about 9 months (9.21) per La Niña event and
opposite direction. That of the influence of the Intertropical about 6 months (6.03) per neutral event. So if for example
Convergence Zone (ITCZ) is undoubtedly one of them: during a semester the stratification rises following an El
Niño event, there is a greater probability that the following
The ITCZ is more in the Southern Hemisphere during quarter it will continue to rise, since the El Niño event with
the austral summer and more in the Northern Hemisphere an average duration of 9 months is very likely to last at least
during the boreal summer. a few more months for the next semester. Likewise, if for
However, the ITCZ brings rainy seasons and monsoons one semester the stratification decreases following a La
which cool the UOS in the vast ocean areas concerned and Niña event of average duration 9 months, there is a greater
therefore reduce the stratification resulting from warming. probability that it will continue to decrease the following
The marine coverage of the ITCZ is much greater when semester, rather than it increase. Given the high frequency
it is positioned south of the Equator than in the north of such events (together, they cover 58.5% of the entire
and therefore counterbalances the stratification caused period 1950 – 2023), this is largely sufficient to explain the
by the austral summer on the temperate latitudes of this fact that the biannual chains concerning the stratification
of the UOS and layer 0 – 2000 m above are pronounced
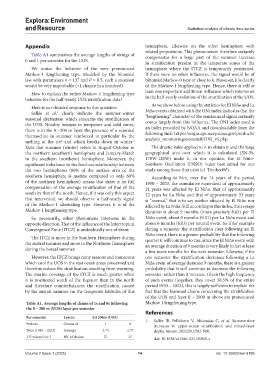
Table A1. Average lengths of chains of 1s and 0s following Markov 1 lengthening type.
the 0 – 200 m (UOS) layer per semester
References
Per semester Layers: 0 à 200m (UOS)
1. Sallée JB, Pellichero V, Akhoudas C, et al. Summertime
Periods Chains of: 1 0
increases in upper-ocean stratification and mixed-layer
Total (1955 – 2023) Average: 2.74 2.37 depth. Nature. 2021;591:592-598.
137 values 0 or 1 Nb. of chains: 27 27
doi: 10.1038/s41586-021-03303-x
Volume 2 Issue 1 (2025) 14 doi: 10.36922/eer.6109