
Page 50 - EER-2-1
P. 50
Explora: Environment
and Resource Statistical analysis of climate time series
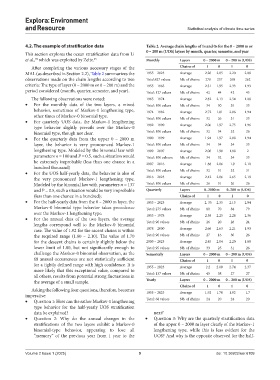
4.2. The example of stratification data Table 2. Average chain lengths of 1s and 0s for the 0 – 2000 m or
0 – 200 m (UOS) layers by month, quarter, semester, and year
This section explores the ocean stratification data from Li
et al., which was exploited by Zeltz. 25 Monthly Layers 0 – 2000 m 0 – 200 m (UOS)
32
After completing the various necessary stages of the Chains of 1 0 1 0
MAL (as described in Section 2.2), Table 2 summarizes the 1955 – 2023 Average 2.20 2.05 2.20 2.08
observations made on the chain lengths according to two Total:827 values Nb. of chains 270 257 268 262
criteria: The type of layer (0 – 2000 m or 0 – 200 m) and the 1955 – 1965 Average 2.31 1.95 2.33 1.93
period considered (month, quarter, semester, and year). Total: 127 values Nb. of chains 42 44 42 45
The following observations were noted: 1965 – 1974 Average 2.82 2.13 2.54 1.88
• For the monthly data of the two layers, a mixed Total: 100 values Nb. of chains 34 30 35 33
behavior, sometimes of Markov-1 lengthening type, 1974 – 1982 Average 2.72 1.81 2.06 1.94
other times of Markov-0 binomial type. Total: 100 values Nb. of chains 32 26 31 33
• For quarterly UOS data, the Markov-1 lengthening
type behavior slightly prevails over the Markov-0 1982 – 1990 Average 2.06 1.97 2.75 1.96
binomial type, though not clear. Total: 100 values Nb. of chains 32 34 32 26
• For the quarterly data from the upper 0 – 2000 m 1990 – 1999 Average 1.94 1.97 2.08 1.94
layer, the behavior is very pronounced Markov-1 Total: 100 values Nb. of chains 34 34 34 33
lengthening type. Modeled by the binomial law with 1999 – 2007 Average 2.00 1.90 1.88 2
parameters n = 100 and P = 0.5, such a situation would Total: 100 valeurs Nb. of chains 34 32 34 33
be extremely improbable (less than one chance in a 2007 – 2016 Average 1.88 2.06 1.9 2.10
hundred thousand)
• For the UOS half-yearly data, the behavior is also of Total: 100 values Nb. of chains 32 31 32 31
the very pronounced Markov-1 lengthening type. 2016 – 2023 Average 2.42 2.06 2.65 2.19
Modeled by the binomial law with parameters n = 137 Total: 100 values Nb. of chains 26 31 26 26
and P = 0.5, such a situation would be very improbable Quarterly Layers 0–2000 m 0–200 m (UOS)
(less than one chance in a hundred); Chains of 1 0 1 0
• For the half-yearly data from the 0 – 2000 m layer, the 1955 – 2023 Average 2. 35 2.35 2.13 2.04
Markov-0 binomial type behavior takes precedence Total: 275 values Nb. of chains 80 70 84 79
over the Markov-1 lengthening type. 1955 – 1978 Average 2.38 2.25 2.28 2.36
• For the annual data of the two layers, the average Total: 90 values Nb. of chains 26 20 26 24
lengths correspond well to the Markov-0 binomial
case. The value of 1.92 for the ascent chains is within 1978 – 2000 Average 2.66 2.63 2.21 1.93
the required range (1.80 – 2.10). The value of 1.70 Total: 90 values Nb. of chains 27 16 30 26
for the descent chains is certainly slightly below the 2000 – 2023 Average 2.45 2.04 2.20 1.89
lower limit of 1.80, but not significantly enough to Total: 95 values Nb. of chains 33 25 31 26
challenge the Markov-0 binomial observation, as the Semesterly Layers 0 – 2000 m 0 – 200 m (UOS)
68 annual occurrences are not statistically sufficient Chains of 1 0 1 0
for a tightly defined range with high confidence. It is 1955 – 2023 Average 2.2 2.00 2.74 2.37
more likely that this exceptional value, compared to
all others, results from potential strong fluctuations in Total: 137 values Nb. of chains 45 38 27 27
the average of a small sample. Yearly Layers 0 – 2000 m 0 – 200 m (UOS)
Chains of 1 0 1 0
Asking the following four questions, therefore, becomes 1955 – 2023 Average 1.92 1.70 1.92 1.7
imperative:
• Question 1: How can the rather Markov-1 lengthening Total: 68 values Nb. of chains 24 20 24 20
type behavior for the half-yearly UOS stratification
data be explained? next?
• Question 2: Why do the annual changes in the • Question 3: Why are the quarterly stratification data
stratifications of the two layers exhibit a Markov-0 of the upper 0 – 2000 m layer clearly of the Markov-1
binomial-type behavior, appearing to lose all lengthening type, while this is less evident for the
“memory” of the previous year from 1 year to the UOS? And why is the opposite observed for the half-
Volume 2 Issue 1 (2025) 9 doi: 10.36922/eer.6109