
Page 48 - EER-2-1
P. 48
Explora: Environment
and Resource Statistical analysis of climate time series
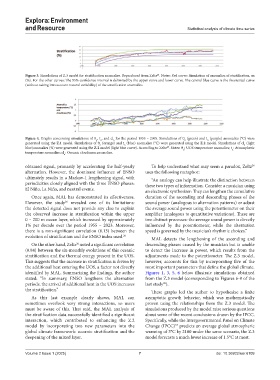
Figure 3. Simulations of Z.3 model for stratification anomalies. Reproduced from Zeltz . Notes: Red curve: Simulation of anomalies of stratification, sn
26
(%). For the other curves: The 95% confidence interval is delimited by the upper curve and lower curve. The central blue curve is the theoretical curve
(without taking into account natural variability) of the stratification anomalies.
Figure 4. Graphs concerning simulations of θ , t , and cl for the period 1955 – 2095. Simulations of θ (green) and t (purple) anomalies (°C) were
n
n
n
n
n
generated using the Z.1 model. Simulations of θ (orange) and t (blue) anomalies (°C) were generated using the Z.2 model. Simulations of cl (light
n
n
n
25
blue)anomalies (%) were generated using the Z.2 model (light blue curve). According to Zeltz . Notes: θ : UOS temperature anomalies; t : Atmospheric
n
n
temperature anomalies; cl : Oceanic cloudiness anomalies.
n
obtained signal, primarily by accelerating the half-yearly To help understand what may seem a paradox, Zeltz
26
alternation. However, the dominant influence of ENSO uses the following metaphor:
ultimately results in a Markov-1 lengthening signal, with “An analogy can help illustrate the distinction between
periodicities closely aligned with the three ENSO phases: these two types of information. Consider a musician using
El Niño, La Niña, and neutral events. an electronic synthesizer: They can lengthen the cumulative
Once again, MAL has demonstrated its effectiveness. duration of the ascending and descending phases of the
However, the study revealed one of its limitations: sound power (analogous to alternation patterns) or adjust
26
the detected signal does not provide any clue to explain the average sound power using the potentiometer on their
the observed increase in stratification within the upper amplifier (analogous to quantitative variations). These are
0 – 200 m ocean layer, which increased by approximately two distinct processes: the average sound power is directly
1% per decade over the period 1955 – 2023. Moreover, influenced by the potentiometer, while the alternation
there is a non-significant correlation (0.13) between the speed is governed by the musician’s rhythmic choices.”
evolution of stratification and the ENSO index used. 26 MAL detects the lengthening of the ascending and
On the other hand, Zeltz noted a significant correlation descending phases caused by the musician but is unable
26
(0.84) between the six-monthly evolutions of this oceanic to detect the increase in power, which results from the
stratification and the thermal energy present in the UOS. adjustments made to the potentiometer. The Z.3 model,
This suggests that the increase in stratification is driven by however, accounts for this by incorporating five of the
the additional heat entering the UOS, a factor not directly most important parameters that define the global climate.
identified by MAL. Summarizing the findings, the author Figures 1, 3, 5, 6 below illustrate simulations obtained
stated: “In summary, ENSO lengthens the alternation from the Z.3 model (corresponding to Figures 6-9 of the
periods, the arrival of additional heat in the UOS increases last study ).
26
the stratification.” These graphs led the author to hypothesize a finite
As this last example clearly shows, MAL can asymptotic growth behavior, which was mathematically
sometimes overlook very strong interactions, so users proven using the relationships from the Z.3 model. The
must be aware of this. That said, the MAL analysis of simulations produced by the model raise serious questions
the stratification data successfully identified a significant about some of the recent conclusions drawn by the IPCC.
interaction, which contributed to enhancing the Z.2 Specifically, while the Intergovernmental Panel on Climate
model by incorporating two new parameters into the Change (IPCC) predicts an average global atmospheric
34
global climate framework: oceanic stratification and the warming of 3°C by 2100 under the same scenario, the Z.3
deepening of the mixed layer. model forecasts a much lower increase of 1.5°C at most.
Volume 2 Issue 1 (2025) 7 doi: 10.36922/eer.6109