
Page 225 - EJMO-9-2
P. 225
Eurasian Journal of
Medicine and Oncology RCT of rTMS combined with HT for PSD
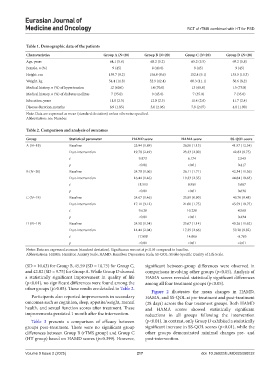
Table 1. Demographic data of the patients
Characteristics Group A (N=20) Group B (N=20) Group C (N=20) Group D (N=20)
Age, years 64.1 (5.6) 68.2 (5.2) 65.2 (5.5) 69.2 (5.8)
Female, n (%) 9 (45) 8 (40.0) 9 (45) 9 (45)
Height, cm 159.7 (9.2) 156.0 (8.6) 152.4 (9.1) 153.5 (10.3)
Weight, kg 54.4 (11.8) 52.9 (12.4) 60.3 (11.1) 56.6 (8.2)
Medical history, n (%) of hypertension 12 (60.0) 14 (70.0) 13 (65.0) 15 (75.0)
Medical history, n (%) of diabetes mellitus 7 (35.0) 9 (45.0) 7 (35.0) 7 (35.0)
Education, years 11.8 (2.5) 12.0 (2.3) 11.4 (2.6) 11.7 (2.4)
Disease duration, months 6.9 (1.85) 5.0 (2.06) 7.9 (2.07) 4.8 (1.90)
Note: Data are expressed as mean (standard deviation) unless otherwise specified.
Abbreviation: no.: Number.
Table 2. Comparison and analysis of outcomes
Group Statistical parameter HAMD score HAMA score SS‑QOL score
A (N=19) Baseline 23.94 (1.89) 26.50 (1.15) 41.97 (12.54)
Post-intervention 19.78 (2.49) 23.33 (2.00) 42.82 (9.75)
t 9.873 6.174 2.543
p <0.01 <0.01 0.417
B (N=20) Baseline 24.78 (1.06) 26.11 (1.71) 42.34 (11.36)
Post-intervention 16.44 (1.46) 19.33 (2.35) 44.84 (10.63)
t 18.513 9.981 3.687
p <0.01 <0.01 0.638
C (N=19) Baseline 24.67 (1.46) 25.89 (0.90) 40.76 (9.48)
Post-intervention 17.11 (3.12) 21.00 (1.75) 45.59 (10.75)
t 9.628 10.238 4.568
p <0.01 <0.01 0.434
D (N=19) Baseline 24.50 (1.54) 25.67 (1.14) 43.26 (11.62)
Post-intervention 14.44 (2.04) 17.39 (2.66) 59.28 (9.82)
t 17.009 14.966 -8.785
p <0.01 <0.01 <0.01
Notes: Data are expressed as mean (standard deviation). Significance was set at p<0.05 compared to baseline.
Abbreviations: HAMA: Hamilton Anxiety Scale; HAMD: Hamilton Depression Scale; SS-QOL: Stroke-Specific Quality of Life Scale.
(SD = 10.63) for Group B, 45.59 (SD = 10.75) for Group C, significant between-group differences were observed in
and 42.82 (SD = 9.75) for Group A. While Group D showed comparisons involving other groups (p<0.05). Analysis of
a statistically significant improvement in quality of life HAMA scores revealed statistically significant differences
(p<0.01), no significant differences were found among the among all four treatment groups (p<0.05).
other groups (p>0.05). These results are detailed in Table 2.
Figure 2 illustrates the mean changes in HAMD,
Participants also reported improvements in secondary HAMA, and SS-QOL at pre-treatment and post-treatment
outcomes such as cognition, sleep, appetite/weight, mental (28 days) across the four treatment groups. Both HAMD
health, and sexual function scores after treatment. These and HAMA scores showed statistically significant
improvements persisted 1 month after the intervention. reductions in all groups following the intervention
Table 3 presents a comparison of efficacy between (p<0.01). In contrast, only Group D exhibited a statistically
groups post-treatment. There were no significant group significant increase in SS-QOL scores (p<0.01), while the
differences between Group B (rTMS group) and Group C other groups demonstrated minimal changes pre- and
(HT group) based on HAMD scores (p=0.399). However, post-intervention.
Volume 9 Issue 2 (2025) 217 doi: 10.36922/EJMO025080032