
Page 110 - GHES-1-1
P. 110
Global Health Econ Sustain Effects of community-based activities on LTC needs
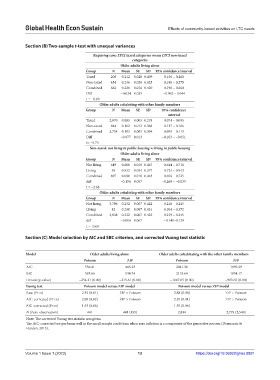
Section (B) Two-sample t-test with unequal variances
Requiring care: LTCI taxed categories versus LTCI non‑taxed
categories
Older adults living alone
Group N Mean SE SD 95% confidence interval
Taxed 208 0.212 0.028 0.409 0.156 – 0.268
Non-taxed 454 0.236 0.020 0.425 0.196 – 0.275
Combined 662 0.228 0.016 0.420 0.196 – 0.260
Diff −0.024 0.035 −0.092 – 0.044
t = –0.69
Older adults cohabiting with other family members
Group N Mean SE SD 95% confidence
interval
Taxed 2,870 0.085 0.005 0.278 0.074 – 0.095
Non-taxed 884 0.162 0.012 0.368 0.137 – 0.186
Combined 3,754 0.103 0.005 0.304 0.093 – 0.113
Diff –0.077 0.013 –0.103 – –0.051
t= –5.73
Non‑taxed: not living in public housing vs living in public housing
Older adults living alone
Group N Mean SE SD 95% confidence interval
Not living 649 0.680 0.018 0.467 0.644 – 0.716
Living 48 0.833 0.054 0.377 0.724 – 0.943
Combined 697 0.690 0.018 0.463 0.656 – 0.725
diff –0.154 0.057 –0.269 – –0.039
t = –2.68
Older adults cohabiting with other family members
Group N Mean SE SD 95% confidence interval
Not living 3,796 0.232 0.007 0.422 0.218 – 0.245
Living 42 0.238 0.067 0.431 0.104 – 0.372
Combined 3,838 0.232 0.007 0.422 0.219 – 0.245
diff −0.006 0.067 −0.141−0.129
t = -0.09
Section (C) Model selection by AIC and SBC criterion, and corrected Vuong test statistic
Model Older adults living alone Older adults cohabitating with the other family members
Poisson ZIP Poisson ZIP
AIC 536.41 465.23 2041.30 1839.29
BIC 593.66 534.74 2118.64 1934.17
LR test (p-value) −254.21 (0.00) −215.61 (0.00) −1007.65 (0.00) −903.65 (0.00)
Vuong test Poisson model versus ZIP model Poisson model versus ZIP model
Raw (Pr<z) 2.35 (0.01) ZIP > Poisson 2.88 (0.00) ZIP > Poisson
AIC-corrected (Pr<z) 2.08 (0.02) ZIP > Poisson 2.55 (0.01) ZIP > Poisson
BIC-corrected (Pr<z) 1.53 (0.06) 1.55 (0.06)
N (Zero observation) 441 441 (355) 2,834 2,779 (2,540)
Note: The corrected Vuong test statistic was given.
The AIC-corrected test performs well in the small sample conditions when zero inflation is a component of the generative process (Desmarais &
Harden, 2013).
Volume 1 Issue 1 (2023) 13 https://doi.org/10.36922/ghes.0891