
Page 67 - GHES-2-2
P. 67
Global Health Econ Sustain Attributes of Ebola epidemic in West Africa
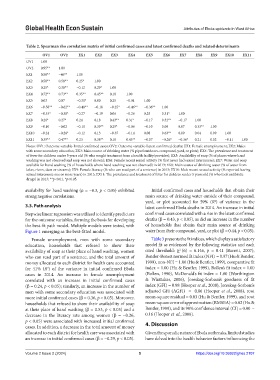
Table 2. Spearman rho correlation matrix of initial confirmed cases and latest confirmed deaths and related determinants
OV1 OV2 EX1 EX2 EX3 EX4 EX5 EX6 EX7 EX8 EX9 EX10 EX11
OV1 1.00
OV2 0.95** 1.00
EX1 0.50** −46** 1.00
EX2 0.50** 0.58** 0.25* 1.00
EX3 0.25* 0.38** −0.12 0.29* 1.00
EX4 0.72** 0.73** 0.35** 0.45** 0.18 1.00
EX5 0.03 0.07 −0.30* 0.00 0.25 −0.01 1.00
EX6 −0.58** −0.62** −0.48** −0.18 −0.25* −0.46** −0.36** 1.00
EX7 −0.33* −0.30* −0.27 −0.19 0.06 −0.26 0.25 0.31* 1.00
EX8 0.26* 0.27* 0.24 0.18 0.43** 0.31* −0.17 0.32** −0.17 1.00
EX9 −0.10 −0.02 −0.10 0.39** 0.29* −0.06 −0.10 0.09 0.07 0.33** 1.00
EX10 −0.24 −0.26* −0.12 0.13 −0.37 −0.14 0.08 0.63** 0.09 0.04 0.09 1.00
EX11 0.39** 0.47** 0.23 0.38** 0.18 0.43** −0.07 −0.26* −0.36* 0.21 0.02 −0.11 1.00
Notes: OV1: Outcome variable-Initial confirmed cases; OV2: Outcome variable-Latest confirmed deaths; EX1: Female unemployment; EX2: Males
with some secondary education; EX3: Main source of drinking water (% piped outdoors-compound, yard, or plots); EX4: The prevalence and treatment
of fever for children under 5 years old (% who sought treatment from a health facility/provider); EX5: Availability of soap (% of places where hand
washing was not observed and soap was not shown); EX6: Female recent sexual activity (% that never had sexual intercourse); EX7: Water and soap
available for hand washing (% of households where hand washing was not observed) in 2013; EX8: Main source of drinking water (% of water from
lakes, rivers, dam or streams); EX9: Female literacy (% who can read part of a sentence) in 2013; EX10: Male recent sexual activity (% reported having
sexual intercourse one or more years) in 2013; EX11: The prevalence and treatment of fever for children under 5 years old (% who took antibiotic
drugs) in 2013; **p<0.01, *p<0.05.
availability for hand washing (ρ = −0.3, p < 0.05) exhibited Initial confirmed cases and households that obtain their
strong negative correlations. main source of drinking water outside of their compound,
yard, or plot accounted for 59% (R ) of variance in the
2
3.3. Path analysis latest confirmed Ebola deaths in 2014. An increase in initial
Stepwise linear regression was utilized to identify predictors confirmed cases correlated with a rise in the latest confirmed
for the outcome variables, forming the basis for developing deaths (β = 0.43, p < 0.05), as did an increase in the number
the best-fit path model. Multiple models were tested, with of households that obtain their main source of drinking
Figure 1 emerging as the best-fitted model. water from their compound, yard, or plot (β = 0.44, p < 0.05).
Female unemployment, men with some secondary Table 3 presents the fit indices, which display a satisfactory
education, households that refused to show their model fit as evidenced by the following statistics and each
2
availability of soap at their place of hand washing, women cited threshold: χ (6) = 6.146, p = 0.41 (Barrett, 2007),
who can read part of a sentence, and the total amount of Bentler-Bonett normed fit index (NFI) = 0.97 (Hu & Bentler,
money allocated to each district for health care accounted 1999), non-NFI = 1.00 (Hu & Bentler, 1999), comparative fit
for 41% (R ) of the variance in initial confirmed Ebola index = 1.00 (Hu & Bentler, 1999), Bollen’s fit index = 1.00
2
cases in 2014. An increase in female unemployment (Bollen, 1990), McDonald’s fit index = 1.00 (Worthington
correlated with an increase in initial confirmed cases & Whittaker, 2006), Joreskog-Sorbom’s goodness of fit
(β = 0.24, p < 0.05); similarly, an increase in the number of index (GFI) = 0.98 (Hooper et al., 2008), Joreskog-Sorbom’s
men with some secondary education was associated with adjusted GFI (AGFI) = 0.86 (Hooper et al., 2008), root
more initial confirmed cases (β = 0.36, p < 0.05). Moreover, mean-square residual = 0.03 (Hu & Bentler, 1999), and root
households that refused to show their availability of soap mean-square error of approximation (RMSEA) = 0.02 (Hu &
at their place of hand washing (β = 0.53, p < 0.05) and a Bentler, 1999), and its 90% confidence interval (CI) = 0.00 –
decrease in the literacy rate among women (β = −0.26, 0.16 (Hooper et al., 2008).
p < 0.05) were associated with increased initial confirmed 4. Discussion
cases. In addition, a decrease in the total amount of money
allocated to each district for health care was associated with Given the sporadic nature of Ebola outbreaks, limited studies
an increase in initial confirmed cases (β = −0.29, p < 0.05). have delved into the health behavior factors influencing the
Volume 2 Issue 2 (2024) 5 https://doi.org/10.36922/ghes.2107