
Page 99 - GHES-2-3
P. 99
Global Health Economics and
Sustainability
Fatigue and quality of life in Greek social workers
workers only, while the participants were informed of Table 2. Spearman’s correlations of total, mental, and
the purpose of the research as well as the voluntary and physical fatigue with social support and quality of life
anonymous nature of their responses. Ethical approval Dimensions FAS‑total FAS‑physical FAS‑mental
for this study was obtained from the Committee of the fatigue fatigue fatigue
Association of Social Workers of Greece (protocol number GHQ-physical symptoms
1332/22-12-2023).
Spearman’s correlation 0.648** 0.615** 0.600**
The data collected on the Google Form were converted Sig. (two-tailed) 0.000 0.000 0.000
into Microsoft Excel format, where they were appropriately
coded. Then, they were transferred to the statistical program n 383 388 395
Statistical Package for the Social Sciences version 25, where GHQ-anxiety and insomnia
percentages, frequencies, means, and standard deviations Spearman’s correlation 0.601** 0.542** 0.597**
were calculated to study all the variables covered in the Sig. (two-tailed) 0.000 0.000 0.000
research tool. In addition, Spearman and regression n 383 388 395
analyses were performed to investigate the influence GHQ-social dysfunction
of social support on fatigue and the quality of life of the Spearman’s correlation 0.496** 0.470** 0.470**
respondents.
Sig. (two-tailed) 0.000 0.000 0.000
3. Results n 383 388 395
The FAS component in the questionnaire has a total of GHQ-depressive symptoms
10 statements related to the respondents’ fatigue, with Spearman’s correlation 0.458** 0.368** 0.474**
each being rated from 1 to 5. A higher average score can Sig. (two-tailed) 0.000 0.000 0.000
be interpreted as an increase in the level of fatigue of the n 383 388 395
respondents. It was observed that the minimum value GHQ-overall level of
of the variable was equal to 1 and the maximum to 4.44, symptom occurrence
whereas the average value measured 2.30, reflecting the Spearman’s correlation 0.707** 0.641** 0.690**
low level of fatigue among the respondents. Sig. (two-tailed) 0.000 0.000 0.000
The GHQ-28 component utilized in this survey has a n 383 388 395
total of 28 statements, each of which was rated from 1 to MSPSS-support from
4, with a higher score indicating a higher level of symptom significant others
occurrence. Our results showed that the level of physical Spearman’s correlation −0.297** −0.249** −0.299**
symptoms (2.18) was below average, although it scored Sig. (two-tailed) 0.000 0.000 0.000
the highest across the tested categories. This is followed by
the level of anxiety and insomnia (2.06), the level of social n 383 388 395
dysfunction (1.92), and the level of depressive symptoms MSPSS-support from family
is particularly low (1.26). Finally, the overall level of Spearman’s correlation −0.297** −0.240** −0.308**
symptoms (1.86) was determined to be lower than the Sig. (two-tailed) 0.000 0.000 0.000
average score. n 383 388 395
The MSPSS used in the current study encompassed 12 MSPSS-support from friends
statements, each of which was rated from 1 to 7, with an Spearman’s correlation −0.304** −0.240** −0.310**
increase in the average value indicating an increase in the Sig. (two-tailed) 0.000 0.000 0.000
support received by the respondents. Based on the results, n 383 388 395
support from significant others (5.79) was a highly cited MSPSS-overall level
source of support, followed by support from friends (5.57) of support from the
and support from family (5.44). The overall level of support environment
stands at a high level of 5.60. Spearman’s correlation −0.326** −0.266** −0.333**
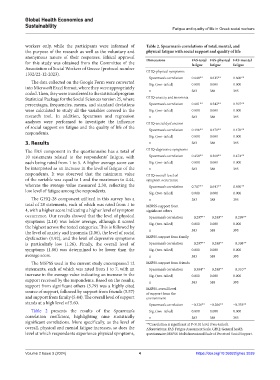
Table 2 presents the results of the Spearman’s Sig. (two-tailed) 0.000 0.000 0.000
correlation coefficient, highlighting nine statistically n 383 388 395
significant correlations. More specifically, as the level of **Correlation is significant at P<0.01 level (two-tailed).
overall, physical and mental fatigue increases, so does the Abbreviations: FAS: Fatigue Assessment Scale; GHQ: General health
level at which respondents experience physical symptoms, questionnaire; MSPSS: Multidimensional Scale of Perceived Social Support.
Volume 2 Issue 3 (2024) 4 https://doi.org/10.36922/ghes.3039