
Page 92 - GHES-2-4
P. 92
Global Health Economics and
Sustainability
Nurse perceptions of quality measured by SERVPERF
Table 2 indicates that the average quality of health et al. (2020), Dalle et al. (2020), and Sulistyorini et al.
services was high, measuring 4.14, with a standard (2021), who emphasized the impact of factors such
deviation of 0.51 and a percentage of 82.8%. Assurance as assurance, reliability, and tangibility on patient
was the most common dimension applied in hospitals,
with a mean of 4.23, a standard deviation of 0.56, and a Table 3. T‑test for quality of health services
percentage of 84.5%. While the dimension of reliability was
Standard
least common in the hospitals under study, with a mean Significance T deviation Mean The dimension
of 4.07, a standard deviation of 0.58, and a percentage of
81.3%. 0.001 20.776 0.51 4.14 Quality of health
services (average)
A one-sample t-test was used. A comparison of the
calculated mean with the hypothesized mean (3), as shown Table 4. Differences in nurses’ perceptions of health service
in Table 3, revealed that the quality of health services is of a quality across different hospitals
high level, with statistical significance (p < 0.05).
Significance F Standard deviation Mean n Hospitals
Table 4 illustrates the differences in nurses’ perceptions
of health service quality across different hospitals. There 0.001 4.865 0.55289 3.7802 40 Hospital A
was a statistically significant difference (p < 0.001) between 0.40403 4.1668 14 Hospital B
the hospitals. These findings suggest that the hospital 0.46198 4.0377 14 Hospital C
variable plays a role in determining nurses’ views on quality 0.78522 3.664 10 Hospital E
(Table 4). With a p < 0.05 indicating statistical significance, 0.46477 4.4065 10 Hospital D
it is evident from Table 4 that there are differences in 0.51466 4.1398 88 Total
the responses of the individuals in the research sample
regarding the quality of health services attributed to the
hospital variable. Table 5. Pairwise comparison in nurses’ perceptions of
health service quality between hospitals
The study used the least significant difference (LSD)
test for multiple comparisons, as shown in Table 5. The Significance Average Standard Hospital for Hospital
difference
error
(I)
comparison
purpose of the LSD test was to identify which specific (I‑J) (J)
hospital differences were the least significant. This helps 0.033 0.38655* 0.1785 Hospital A Hospital B
determine where the most or least difference in quality
perceptions between pairs of hospitals. The test compares 0.354 0.12901 0.13838 Hospital C
the mean quality rating of each hospital to that of every 0.053 0.50275 0.25612 Hospital E B
other hospital to determine significant differences. 0.075 −0.23977 0.13305 Hospital D Hospital
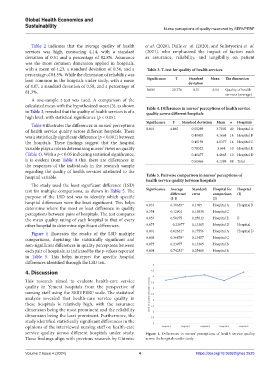
Figure 1 illustrates the results of the LSD multiple 0.001 0.62632* 0.17556 Hospital A Hospital D
comparisons, depicting the statistically significant and 0.008 0.36878* 0.13457 Hospital C
non-significant differences in quality perceptions between 0.075 0.23977 0.13305 Hospital B
each pair of hospitals, as indicated by the p-values reported 0.004 0.74252* 0.25408 Hospital E
in Table 5. This helps interpret the specific hospital
differences identified through the LSD test.
4. Discussion
This research aimed to evaluate health-care service
quality in Yemeni hospitals from the perspective of
nursing staff using the SERVPERF scale. The statistical
analysis revealed that health-care service quality in
these hospitals is relatively high, with the assurance
dimension being the most prominent and the reliability
dimension being the least prominent. Furthermore, the
study identified statistically significant differences in the
opinions of the interviewed nursing staff on health-care
service quality across different hospitals under study. Figure 1. Differences in nurses’ perceptions of health service quality
These findings align with previous research by Ghimire across the hospitals under study
Volume 2 Issue 4 (2024) 4 https://doi.org/10.36922/ghes.2525