
Page 91 - GHES-2-4
P. 91
Global Health Economics and
Sustainability
Nurse perceptions of quality measured by SERVPERF
interactions and are protected from risk or danger. It consistency. In this study, an overall Cronbach’s alpha value
gauges whether hospital practices help prevent errors, of 0.72 was obtained, indicating satisfactory reliability of
transmission of infections, and other risks to patient the questionnaire.
well-being.
• Empathy encompasses caring, individualized 2.4.3. Dimension analysis
attention provided to patients. It assesses whether staff The five dimensions of service quality (tangibility,
pays attention, communicates well, and understands reliability, responsiveness, empathy, and assurance) were
specific patient needs and preferences. analyzed separately to determine nurses’ perceptions of
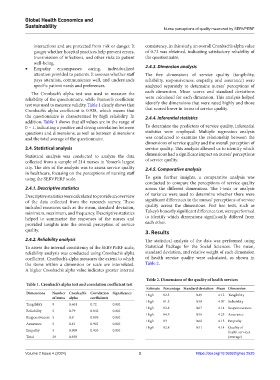
The Cronbach’s alpha test was used to measure the each dimension. Mean scores and standard deviations
reliability of the questionnaire, while Pearson’s coefficient were calculated for each dimension. This analysis helped
test was used to measure validity. Table 1 clearly shows that identify the dimensions that were rated highly and those
Cronbach’s alpha coefficient is 0.938, which means that that scored lower in terms of service quality.
the questionnaire is characterized by high reliability. In 2.4.4. Inferential statistics
addition, Table 1 shows that all values are in the range of
0 – 1, indicating a positive and strong correlation between To determine the predictors of service quality, inferential
questions and dimensions, as well as between dimensions statistics were employed. Multiple regression analysis
and the total average of the questionnaire. was conducted to examine the relationship between the
dimensions of service quality and the overall perception of
2.4. Statistical analysis service quality. This analysis allowed us to identify which
Statistical analysis was conducted to analyze the data dimensions had a significant impact on nurses’ perceptions
collected from a sample of 214 nurses in Yemen’s largest of service quality.
city. The aim of the analysis was to assess service quality 2.4.5. Comparative analysis
in healthcare, focusing on the perceptions of nursing staff
using the SERVPERF scale. To gain further insights, a comparative analysis was
conducted to compare the perceptions of service quality
2.4.1. Descriptive statistics across the different dimensions. The t-tests or analysis
Descriptive statistics were calculated to provide an overview of variance were used to determine whether there were
of the data collected from the research survey. These significant differences in the nurses’ perceptions of service
included measures such as the mean, standard deviation, quality across the dimensions. Post hoc tests, such as
minimum, maximum, and frequency. Descriptive statistics Tukey’s honestly significant difference test, were performed
helped to summarize the responses of the nurses and to identify which dimensions significantly differed from
provided insights into the overall perception of service each other.
quality. 3. Results
2.4.2. Reliability analysis The statistical analysis of the data was performed using
To assess the internal consistency of the SERVPERF scale, Statistical Package for the Social Sciences. The mean,
reliability analysis was conducted using Cronbach’s alpha standard deviation, and relative weight of each dimension
coefficient. Cronbach’s alpha measures the extent to which of health service quality were calculated, as shown in
the items within a dimension or scale are interrelated. Table 2.
A higher Cronbach’s alpha value indicates greater internal
Table 2. Dimensions of the quality of health services
Table 1. Cronbach’s alpha test and correlation coefficient test
Estimate Percentage Standard deviation Mean Dimension
Dimensions Number Cronbach’s Correlation Significance High 82.3 0.49 4.12 Tangibility
of items alpha coefficients
Tangibility 9 0.661 0.72 0.001 High 81.3 0.58 4.07 Reliability
High 82.8 0.67 4.14 Responsiveness
Reliability 5 0.79 0.843 0.001
High 84.5 0.56 4.23 Assurance
Responsiveness 5 0.9 0.895 0.001
High 83 0.68 4.15 Empathy
Assurance 5 0.81 0.901 0.001
High 82.8 0.51 4.14 Quality of
Empathy 5 0.908 0.933 0.001 health services
Total 29 0.938 (average)
Volume 2 Issue 4 (2024) 3 https://doi.org/10.36922/ghes.2525