
Page 208 - GHES-3-1
P. 208
Global Health Economics and
Sustainability
Cervical cancer screening in Maroua
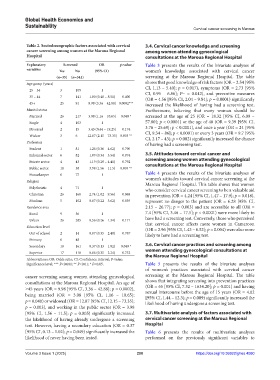
Table 2. Sociodemographic factors associated with cervical 3.4. Cervical cancer knowledge and screening
cancer screening among women at the Maroua Regional among women attending gynecological
Hospital consultations at the Maroua Regional Hospital
Explanatory Screened OR p‑value Table 3 presents the results of the bivariate analyses of
variables Yes No (95% CI) women’s knowledge associated with cervical cancer
(n=35) (n=341) screening at the Maroua Regional Hospital. The table
Age group (years) shows that good knowledge of risk factors (OR = 2.54 [95%
25 – 34 3 109 1 CI, 1.13 – 5.40]; p = 0.017), symptoms (OR = 2.73 [95%
CI, 0.95 – 6.86]; P− = 0.042), and preventive measures
35 – 44 7 141 1.80 (0.48 – 8.51) 0.400 (OR = 4.56 [95% CI, 2.04 – 9.84]; p = 0.0001) significantly
45+ 25 91 9.98 (3.36 – 42.88) 0.0002*** increased the likelihood of having had a screening test.
Marital status Furthermore, believing that every woman should be
Married 26 217 3.08 (1.16 – 10.65) 0.040 * screened at the age of 25 (OR = 18.32 [95% CI, 6.09 –
Single 4 103 1 57.80]; p < 0.0001) or the age of 40 (OR = 9.39 [95% CI,
Divorced 2 15 3.43 (0.44 – 19.25) 0.174 3.76 – 25.69]; p < 0.0001), and once a year (OR = 24 [95%
Widow 3 6 12.87 (2.15 – 73.35) 0.003 ** CI, 9.34 – 86]; p < 0.0001) or every 3 years (OR = 9.7 [95%
CI, 2.17 – 43]; p = 0.002) significantly increased the chance
Profession of having had a screening test.
Student 1 81 1.26 (0.36 – 4.62) 0.790
Informal sector 6 82 1.09 (0.34 – 3.54) 0.874 3.5. Attitudes toward cervical cancer and
Private sector 4 43 1.19 (0.29 – 4.41) 0.792 screening among women attending gynecological
consultations at the Maroua Regional Hospital
Public sector 18 58 3.98 (1.56 – 11.5) 0.005 **
Housekeeper 6 77 1 Table 4 presents the results of the bivariate analyses of
Religion women’s attitudes toward cervical cancer screening at the
Maroua Regional Hospital. This table shows that women
Polytheistic 4 71 1 who consider cervical cancer screening to be a valuable aid
Christian 26 168 2.74 (1.02 – 9.56) 0.068 in prevention (OR = 4.24 [95% CI, 1.47 – 17.9]; p = 0.018),
Muslims 5 102 0.87 (0.22 – 3.62) 0.839 represent no danger to the patient (OR = 6.28 [95% CI,
Residence area 2.15 – 26.77]; p = 0.003) and are accessible to all (OR =
Rural 9 56 1 7.4 [95% CI, 3.46 – 17.5]; p < 0.0001) were more likely to
Urban 26 285 0.56 (0.26 – 1.34) 0.171 have had a screening test. Conversely, those who perceived
Education level that cervical cancer affects more women in Cameroon
(OR = 2.96 [95% CI, 1.43 – 6.52]; p = 0.004) were also more
Out of school 2 14 0.87 (0.35 – 2.40) 0.787 likely to have had a screening test.
Primary 6 48 1
Secondary 10 161 0.37 (0.13 – 1.02) 0.049 * 3.6. Cervical cancer practices and screening among
Superior 17 118 0.86 (0.35 – 2.24) 0.752 women attending gynecological consultations at
the Maroua Regional Hospital
Abbreviations: OR: Odds ratio; CI: Confidence interval; P-value:
Significance level; *** P<0.001; ** P<0.01; * P<0.05. Table 5 presents the results of the bivariate analyses
of women’s practices associated with cervical cancer
cancer screening among women attending gynecological screening at the Maroua Regional Hospital. The table
consultations at the Maroua Regional Hospital. An age of shows that integrating screening into prevention practices
≥45 years (OR = 9.98 [95% CI, 3.36 – 42.88]; p = 0.0002), (OR = 65 [95% CI, 7.32 – 1634.20]; p = 0.001) and having
being married (OR = 3.08 [95% CI, 1.16 – 10.65]; sexual intercourse before the age of 15 years (OR = 4.02
[95% CI, 1.44 – 12.3]; p = 0.009) significantly increased the
p = 0.040) or widowed (OR = 12.87 [95% CI, 12.15 – 73.35]; likelihood of having undergone a screening test.
p = 0.003), and working in the public sector (OR = 3.98
[95% CI, 1.56 – 11.5]; p = 0.005) significantly increased 3.7. Multivariate analysis of factors associated with
the likelihood of having already undergone a screening cervical cancer screening at the Maroua Regional
test. However, having a secondary education (OR = 0.37 Hospital
[95% CI, 0.13 – 1.02]; p = 0.049) significantly increased the Table 6 presents the results of multivariate analyses
likelihood of never having been tested. performed on the previously significant variables to
Volume 3 Issue 1 (2025) 200 https://doi.org/10.36922/ghes.4080