
Page 198 - GHES-3-3
P. 198
Global Health Economics and
Sustainability
Blood exposure in Cameroon healthcare workers
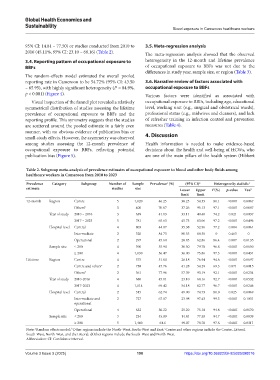
95% CI: 14.81 – 77.50) or studies conducted from 2010 to 3.5. Meta-regression analysis
2016 (45.11%, 95% CI: 23.10 – 68.16) (Table 2).
The meta-regression analysis showed that the observed
3.4. Reporting pattern of occupational exposure to heterogeneity in the 12-month and lifetime prevalence
BBFs of occupational exposure to BBFs was not due to the
differences in study year, sample size, or region (Table 3).
The random-effects model estimated the overall pooled
reporting rate in Cameroon to be 54.72% (95% CI: 43.50 3.6. Narrative review of factors associated with
– 65.95), with highly significant heterogeneity (I = 84.9%, occupational exposure to BBFs
2
p < 0.001) (Figure 4). Various factors were identified as associated with
Visual inspection of the funnel plot revealed a relatively occupational exposure to BBFs, including age, educational
symmetrical distribution of studies assessing the lifetime level, working unit (e.g., surgical and obstetrical wards),
prevalence of occupational exposure to BBFs and the professional status (e.g., midwives and cleaners), and lack
reporting profile. This symmetry suggests that the studies of refresher training in infection control and prevention
are scattered around the pooled estimate in a fairly even measures (Table 4).
manner, with no obvious evidence of publication bias or
small-study effects. However, the asymmetry was observed 4. Discussion
among studies assessing the 12-month prevalence of Health information is needed to make evidence-based
occupational exposure to BBFs, reflecting potential decisions about the health and well-being of HCWs, who
publication bias (Figure 5). are one of the main pillars of the health system (Hibbert
Table 2. Subgroup meta‑analysis of prevalence estimates of occupational exposure to blood and other body fluids among
healthcare workers in Cameroon from 2010 to 2023
Prevalence Category Subgroup Number of Sample Prevalence (%) (95% CI) a Heterogeneity statistic a
a
estimate studies size Lower Upper I (%) p‑value Tau 2
2
limit limit
12-month Region Centre 5 1,020 46.25 38.25 54.35 80.1 ˂0.001 0.0067
Others b 3 400 70.87 37.26 95.13 97.1 ˂0.001 0.0887
Year of study 2010 – 2016 3 639 41.13 33.11 49.40 74.2 0.021 0.0037
2017 – 2023 5 781 65.63 45.73 83.06 97.2 ˂0.001 0.0496
Hospital level Central 4 803 44.07 35.38 52.96 77.2 0.004 0.0061
Intermediate 2 320 84.73 80.55 88.50 0 0.463 0
Operational 2 297 45.60 28.85 62.86 86.4 0.007 0.0135
Sample size ˂ 200 4 390 55.90 30.50 79.78 96.8 ˂0.001 0.0650
≥ 200 4 1,030 56.47 36.00 75.86 97.3 ˂0.001 0.0431
Lifetime Region Centre 4 575 51.80 26.18 76.94 94.6 ˂0.001 0.0697
Centre and others c 2 758 47.76 41.28 54.29 69.3 0.071 0.0015
Others d 2 361 77.96 57.39 93.19 92.1 ˂0.001 0.0234
Year of study 2010-2016 4 680 45.11 23.10 68.16 92.7 ˂0.001 0.0532
2017-2023 4 1,014 69.42 54.18 82.77 96.7 ˂0.001 0.0246
Hospital level Central 2 315 62.74 49.90 74.73 80.0 0.025 0.0069
Intermediate and 2 727 67.07 23.98 97.43 99.3 ˂0.001 0.1031
operational
Operational 4 652 50.22 25.20 75.18 94.8 ˂0.001 0.0670
Sample size ˂ 200 3 234 45.09 14.81 77.50 94.7 ˂0.001 0.0839
≥ 200 5 1,460 64.6 49.07 78.70 97.6 ˂0.001 0.0311
Note: Random effects model; Other regions include the North-West, South-West and East; Centre and other regions include the Centre, Littoral,
a
c
b
South-West, North-West, and the Littoral; dOther regions include the South-West and North-West.
Abbreviation: CI: Confidence interval.
Volume 3 Issue 3 (2025) 190 https://doi.org/10.36922/GHES025090016