
Page 104 - GPD-3-2
P. 104
Gene & Protein in Disease Inhibition of SOD1 in diseases
Simulations 2005 (OPLS-2005) force field was utilized Enrichment virtual screening was conducted on human
for the simulations, and the models were neutralized by SOD1 to identify compounds with potential modulatory
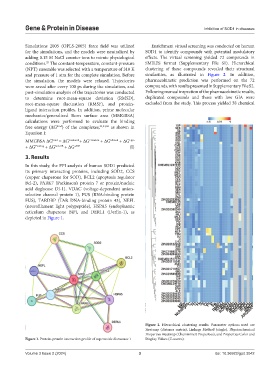
adding 0.15 M NaCl counter ions to mimic physiological effects. The virtual screening yielded 72 compounds in
conditions. The constant-temperature, constant-pressure SMILES format (Supplementary File S1). Hierarchical
25
(NPT) ensemble was selected with a temperature of 310 K clustering of these compounds revealed their structural
and pressure of 1 atm for the complete simulation. Before similarities, as illustrated in Figure 2. In addition,
the simulation, the models were relaxed. Trajectories pharmacokinetic prediction was performed on the 72
were saved after every 100 ps during the simulation, and compounds, with results presented in Supplementary File S2.
post-simulation analysis of the trajectories was conducted Following manual inspection of the pharmacokinetic results,
to determine root-mean-square deviation (RMSD), duplicated compounds and those with low GIA were
root-mean-square fluctuation (RMSF), and protein- excluded from the study. This process yielded 38 chemical
ligand interaction profiles. In addition, prime molecular
mechanics/generalized Born surface area (MMGBSA)
calculations were performed to evaluate the binding
free energy (ΔG bind ) of the complexes, 23,24,26 as shown in
Equation I:
MMGBSA ΔG bind = ΔG Coulomb + ΔG Covalent + ΔG Hbond + ΔG Lipo
+ ΔG Packing + ΔG SolvGB + ΔG vdW (I)
3. Results
In this study, the PPI analysis of human SOD1 predicted
its primary interacting proteins, including SOD2, CCS
(copper chaperone for SOD), BCL2 (apoptosis regulator
Bcl-2), PARK7 (Parkinson’s protein 7 or protein/nucleic
acid deglycase DJ-1), VDAC (voltage-dependent anion-
selective channel protein 1), FUS (RNA-binding protein
FUS), TARDBP (TAR DNA-binding protein 43), NEFL
(neurofilament light polypeptide), HSPA5 (endoplasmic
reticulum chaperone BiP), and DERL1 (Derlin-1), as
depicted in Figure 1.
Figure 2. Hierarchical clustering results. Parameter options used are
Heatmap (distance matrix), Linkage Method (single), Physicochemical
Properties Heatmap (ChemmineR Properties), and Properties Color and
Figure 1. Protein-protein interaction profile of superoxide dismutase 1 Display Values (Z-scores).
Volume 3 Issue 2 (2024) 3 doi: 10.36922/gpd.3042