
Page 84 - GTM-1-1
P. 84
Global Translational Medicine Quantification of atherosclerosis
A B
C
D
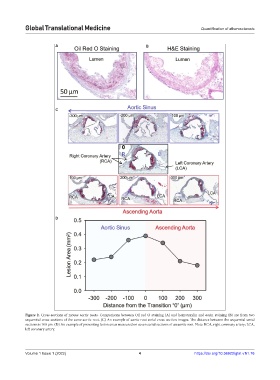
Figure 2. Cross-sections of mouse aortic roots. Comparisons between Oil red O staining (A) and hematoxylin and eosin staining (B) are from two
sequential cross-sections of the same aortic root. (C) An example of aortic root serial cross-section images. The distance between the sequential serial
sections is 100 µm. (D) An example of presenting lesion areas measured on seven serial sections of an aortic root. Note: RCA, right coronary artery; LCA,
left coronary artery.
Volume 1 Issue 1 (2022) 4 https://doi.org/10.36922/gtm.v1i1.76