
Page 136 - GTM-4-1
P. 136
Global Translational Medicine MRgFUS sonication parameters prediction
A B
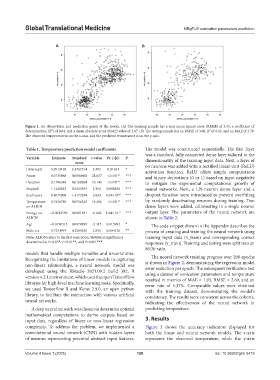
Figure 1. An observation and prediction graph of the model. (A) The training sample has a root mean square error (RMSE) of 3.55, a coefficient of
determination (R²) of 0.64, and a mean absolute error (MAE) value of 2.67. (B) The testing sample has an RMSE of 3.68, R² of 0.62, and an MAE of 2.78.
The observed temperature is on the x-axis, and the predicted temperature is on the y-axis.
Table 1. Temperature prediction model coefficients The model was constructed sequentially. The first layer
was a standard, fully connected dense layer tailored to the
Variable Estimate Standard t-value Pr (>|t|) P dimensionality of the training input data. Next, a layer of
error
(Intercept) 5.9513128 2.4767214 2.403 0.01651 * 64 neurons was added with a rectified linear unit (ReLU)
activation function. ReLU offers simple computations
Power 0.0131968 0.0004608 28.637 <2×10 -16 *** and binary derivations (0 or 1) based on input negativity
Duration 0.1706348 0.0168204 10.145 <2×10 -16 *** to mitigate the exponential computational growth of
Stopped 1.1448043 0.3413393 3.354 0.000838 *** neural networks. Next, a 128-neuron dense layer and a
Scull score 8.4071908 1.4172244 5.932 4.59×10 -09 *** dropout function were introduced to prevent overfitting
Temperature 0.7456789 0.0556243 13.406 <2×10 -16 *** by randomly deactivating neurons during training. Two
on ALIGN dense layers were added, culminating in a single neuron
Energy on −0.0012530 0.0001831 -6.842 1.64×10 -11 *** output layer. The parameters of the neural network are
ALIGN shown in Table 2.
Age −0.0190515 0.0078899 -2.415 0.015992 * The code snippet shown in the Appendix describes the
Male sex 0.7334997 0.2569256 2.855 0.004426 ** process of creating and training the neural network using
Note: ALIGN refers to the first sonication. Statistical significance training input data (x_train) and corresponding correct
determined at P<0.05*, P<0.01**, and P<0.001***. responses (y_train). Training and testing were split into an
80:20 ratio.
models that handle multiple variables and uncertainties.
Recognizing the limitations of linear models in capturing The neural network training progress over 200 epochs
non-linear relationships, a neural network model was is shown in Figure 2, demonstrating the regression model
developed using the RStudio 2021.09.2 build 382, R error reduction per epoch. The subsequent verification test
version 4.2.1 environment, which uses the open TensorFlow using a dataset of sonication parameters and temperature
resulted in metrics of MAE = 1.93, RMSE = 2.69, and an
libraries for high-level machine learning tasks. Specifically, error rate of 5.37%. Comparable values were obtained
we used Tensorflow R and Keras 2.9.0, an open python with the training dataset, demonstrating the model’s
library, to facilitate the interaction with various artificial consistency. The results were consistent across the cohorts,
neural networks. indicating the effectiveness of the neural network in
A deep neural network was chosen to determine optimal predicting temperature.
mathematical computations to derive outputs based on
input data, regardless of linear or non-linear regression 3. Results
complexity. To address the problem, we implemented a Figure 3 shows the accuracy indicators displayed for
convolutional neural network (CNN) with hidden layers both the linear and neural network models. The x-axis
of neurons representing potential abstract input features. represents the observed temperature, while the y-axis
Volume 4 Issue 1 (2025) 128 doi: 10.36922/gtm.5419