
Page 71 - GTM-4-2
P. 71
Global Translational Medicine Glucosidase and metabolic profiles
of MIG on fasting glucose and insulin levels at 15 weeks 35
of age are shown in Figure 3A and B, respectively. These 30 p<0.05
results indicate that MIG treatment was associated with
lower fasting glucose and insulin concentrations by the end 25 p = trend
of the study. The AUC for glucose during a 120-minute oral 20
glucose tolerance test after 7 weeks of treatment is depicted in Units/minute 15
Figure 4. The AUC for MIG-treated rats was approximately 10
20% lower than that of control rats, consistent with the 5 p<0.05
energy intake data from the same timeframe. The HOMA
score showed only a modest decrease, indicating that 0 Glucokinase Malic enzyme G6PD
while insulin resistance was slightly improved, it remained Control Miglitol
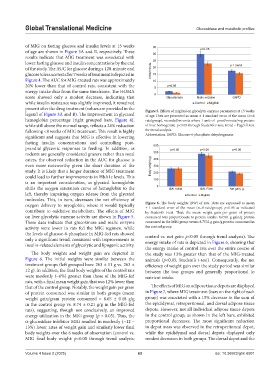
present after the drug treatment (values are provided in the Figure 5. Effects of miglitol on glycolytic enzyme parameters at 15 weeks
legend of Figure 3A and B). The improvement in glycated of age. Data are presented as mean ± 1 standard error of the mean (n=6
hemoglobin percentage (right grouped bars, Figure 4), rats/group), recorded in units where 1 unit=z1 μmol/minute/mg protein
while still above the normal range, reflects a 24% reduction of liver homogenate. p<0.05 through Student’s t-test; trend = Page’s L test
following <8 weeks of MIG treatment. This result is highly for trend analysis.
significant and suggests that MIG is effective in lowering Abbreviation: G6PD: Glucose-6-phosphate dehydrogenase.
fasting insulin concentrations and controlling post-
prandial glycemic responses to feeding. In addition, as 600 p>0.05 p<0.05 p=0.05
rodents are generally considered grazers rather than meal 500
eaters, the observed reduction in the AUC for glucose is 400
even more noteworthy given the short duration of the Body weight (g) 300
study. It is likely that a longer duration of MIG treatment 200
could lead to further improvements in HbA1c levels. This 100
is an important consideration, as glycated hemoglobin
shifts the oxygen saturation curve of hemoglobin to the 0 BW, Initial BW, Final Net gain, g.
left, thereby impairing oxygen release from the glycated Control Miglitol
molecules. This, in turn, decreases the net efficiency of
oxygen delivery to myoglobin, where it would typically Figure 6. The body weights (BW) of rats. Data are expressed as mean
± 1 standard error of the mean (n=8 rats/group). p<0.05 as indicated
contribute to oxidative metabolism. The effects of MIG by Student’s t-test. Thus, the mean weight gain per gram of protein
on liver glycolytic enzyme activity are shown in Figure 5. consumed was proportionate to protein intake: 8.6561 g gain/g protein
These data indicate that glucokinase and malic enzyme consumed in the MIG group versus 8.7532 g gain/g protein consumed in
activity were lower in rats fed the MIG regimen, while the control group.
the levels of glucose-6-phosphate in MIG-fed rats showed control vs. net gain: p<0.05 through trend analysis). The
only a significant trend, consistent with improvements in energy intake of rats is depicted in Figure 6, showing that
insulin-related elements of glycolytic and lipogenic activity.
the energy intake of control rats over the entire course of
The body weights and weight gain are depicted in the study was 13% greater than that of the MIG-treated
Figure 6. The initial weights were similar between the animals (p<0.05, Student’s t-test). Consequently, the net
treatment groups (left grouped bars: 263 ± 11 g vs. 263 ± efficiency of weight gain over the study period was similar
12 g). In addition, the final body weights of the control rats between the two groups and generally proportional to
were modestly (~6%) greater than those of the MIG-fed nutrient intake.
rats, with a final mean weight gain that was 12% lower than
that of the control group. Notably, the weight gain per gram The effects of MIG on adipose tissue depots are displayed
of protein consumed was similar in both groups (mean in Figure 7, where MIG treatment (bars on the right of each
weight gain/gram protein consumed = 8.65 ± 0.18 g/g group) was associated with a 15% decrease in the sum of
in the control group vs. 8.74 ± 0.21 g/g in the MIG-fed the epididymal, retroperitoneal, and dorsal adipose tissue
rats), suggesting, though not conclusively, an improved depots. However, not all individual adipose tissue depots
energy utilization in the MIG group (p > 0.05). Thus, the in the control group, as shown in the left bars, exhibited
α-glucosidase inhibitor MIG resulted in modestly (~12 – proportional decreases. The most significant reduction
13%) lower rates of weight gain and similarly lower final in depot mass was observed in the retroperitoneal depot,
body weights over the 8 weeks of observation (control vs. while the epididymal and dorsal depots displayed only
MIG final body weight: p<0.05 through trend analysis; modest decreases in both groups. The dorsal depot and the
Volume 4 Issue 2 (2025) 63 doi: 10.36922/gtm.6501