
Page 72 - GTM-4-2
P. 72
Global Translational Medicine Glucosidase and metabolic profiles
50 9
p<0.05 *
8
40
7 6
Depot (g) 30 trend p<0.05 trend trend Lipid (mmol/L) 5 4 *
20
10 3 * *
2
0 1
Epididymal Retroperitoneal Dorsal Total WAT WAT/BW, (%) 0
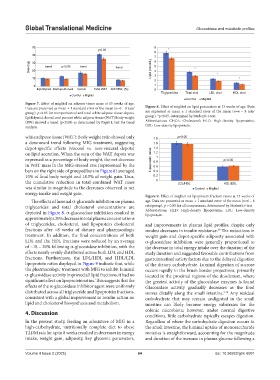
Triglycerides Total chol LDL chol HDL chol
Control Miglitol
Control Miglitol
Figure 7. Effect of miglitol on adipose tissue mass at 15 weeks of age.
Data are presented as mean ± 1 standard error of the mean (n=6 – 8 rats/ Figure 8. Effect of miglitol on lipid parameters at 15 weeks of age. Data
group). p<0.05 for retroperitoneal and total white adipose tissue depots. are expressed as mean ± 1 standard error of the mean (n=6 – 8 rats/
Epididymal, dorsal, and percent white adipose tissue (WAT)/body weight group). *p<0.05, determined by Student’s t-test.
(BW) showed a trend (p<0.05) as determined by Page’s L test for trend Abbreviations: CHOL: Cholesterol; HLD: High-density lipoproteins;
analysis. LDL: Low-density lipoprotein.
white adipose tissue (WAT): Body weight ratio showed only 1.8 p>0.05
a downward trend following MIG treatment, suggesting 1.6
depot-specific effects (visceral vs. non-visceral depots) 1.4
on lipid accretion. When the sum of the WAT depots was 1.2
expressed as a percentage of body weight, the net decrease Lipoprotein ratios 0.8 1 p>0.05
in WAT mass in the MIG-treated rats (represented by the 0.6
bars on the right side of grouped bars in Figure 8) averaged 0.4
10% of final body weight and 18.5% of weight gain. Thus, 0.2
the cumulative reduction in total combined WAT mass 0 LDL/HDL HDL/LDL
was similar in magnitude to the decreases observed in net Control Miglitol
energy intake and weight gain.
Figure 9. Effect of miglitol on lipoprotein fraction ratios at 15 weeks of
The effects of luminal α-glucoside inhibition on plasma age. Data are presented as mean ± 1 standard error of the mean (n=6 – 8
triglycerides and total cholesterol concentrations are rats/group). p > 0.05 for all comparisons, determined by Student’s t-test.
depicted in Figure 8. α-glucosidase inhibition resulted in Abbreviations: HLD: High-density lipoproteins; LDL: Low-density
lipoprotein.
approximately a 20% decrease in total plasma concentrations
of triglycerides, cholesterol, and lipoprotein cholesterol and improvements in plasma lipid profiles, despite only
fractions after <8 weeks of dietary and pharmacologic modest decreases in insulin resistance. The reductions in
30
treatment. In addition, the final concentrations of both weight gain and depot-specific adiposity associated with
LDL and the HDL fractions were reduced by an average α-glucosidase inhibition were generally proportional to
of ~18 – 20% following α-glucosidase inhibition, with the the decrease in total energy intake over the duration of the
effects nearly evenly distributed across both LDL and HDL study duration and suggested favorable contributions from
fractions. Furthermore, the LDL/HDL and HDL/LDL gastrointestinal satiety factors due to the delayed digestion
lipoprotein ratios displayed in Figure 9 indicate that, while of the dietary carbohydrate. Luminal digestion of sucrose
the pharmacologic treatment with MIG to inhibit luminal occurs rapidly in the brush border projections, primarily
α-glucosidase activity improved all lipid fractions, it had no located in the proximal regions of the duodenum, where
significant effect on lipoprotein ratios. This suggests that the the greatest activity of the glucosidase enzymes is found
effects of the α-glucosidase inhibitor agent were uniformly Glucosidase activity gradually decreases as the food
distributed across all triglyceride and lipoprotein fractions, moves distally along the small intestine. Any residual
9,10
consistent with a global improvement in insulin action on carbohydrate that may remain undigested in the small
lipid and cholesterol biosynthesis and metabolism. intestine can likely become energy substrates for the
4. Discussion colonic microbiota; however, under normal digestive
conditions, little carbohydrate typically escapes digestion.
In the present study, feeding an admixture of MIG in a Regardless of where the carbohydrate digestion occurs in
high-carbohydrate, nutritionally complete diet to obese the small intestine, the luminal uptake of monosaccharide
T2DM rats for up to 8 weeks resulted in decreases in energy moieties is straightforward, accounting for the magnitude
intake, weight gain, adiposity, key glycemic parameters, and duration of the increase in plasma glucose following a
Volume 4 Issue 2 (2025) 64 doi: 10.36922/gtm.6501