
Page 96 - GTM-4-3
P. 96
Global Translational Medicine CNNs for overfitting and generalizability in fracture detection
PrecisionRecall× The performance of the trained model was evaluated
F1− score 2= × (VIII)
PrecisionRecall+ on both the validation and test datasets using confusion
matrices (Figure 3). These matrices provide a detailed
These metrics are particularly useful in evaluating the breakdown of the model’s predictions by categorizing
model’s performance on imbalanced datasets, where one them into TPs, TNs, FPs, and FNs. This visualization
class (e.g., fractured cases) might be underrepresented. enables a deeper understanding of the types of errors the
By combining these measures, the evaluation provides model makes. For instance, the number of FPs reveals how
a detailed understanding of the model’s strengths and often the model incorrectly predicts a fracture when there
weaknesses. In addition, confusion matrices are generated is none, while the number of FNs indicates how often the
to visualize the distribution of predictions across the TP, model misses actual fractures. The accuracy achieved on
TN, FP, and FN categories. This analysis offers further each dataset, calculated as the ratio of correctly classified
insights into the model’s performance and its potential for samples to the total number of samples, is also presented
deployment in clinical applications. alongside the confusion matrices, offering a concise
summary of the model’s performance on these datasets.
Metric selection directly addressed clinical priorities.
Recall optimization prioritized fracture detection k-fold cross-validation was employed to evaluate the
sensitivity to minimize missed diagnoses; a critical robustness and generalizability of the trained CNN. The
imperative given the consequences of delayed treatment.
Precision tracking ensured FP rates remained within
clinically tolerable thresholds, acknowledging the
operational costs of unnecessary follow-up imaging.
F1-score balancing provided a composite view of error
tradeoffs, while confusion matrices localized vulnerability
patterns to specific fracture subtypes. External dataset
evaluation explicitly benchmarked cross-institutional
generalizability, emulating real-world deployment where
models encounter unseen data exhibiting protocol-driven
differences.
2.7. Implementation details
The entire workflow was implemented using MATLAB
R2024b. Preprocessing, model training, cross-validation,
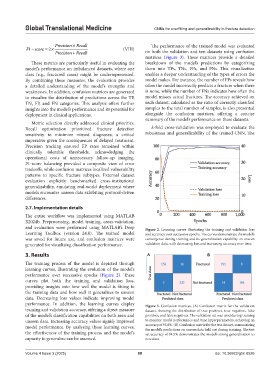
and evaluation were performed using MATLAB’s Deep Figure 2. Learning curves illustrating the training and validation loss
Learning Toolbox (version 24.0). The trained model and accuracy over successive epochs. The curves demonstrate the model’s
was saved for future use, and confusion matrices were convergence during training and its generalization capability on unseen
generated for visualizing classification performance. validation data, with decreasing loss and increasing accuracy over time.
3. Results A B
The training process of the model is depicted through
learning curves, illustrating the evolution of the model’s
performance over successive epochs (Figure 2). These
curves plot both the training and validation loss,
providing insights into how well the model is fitting to
the training data and how well it generalizes to unseen
data. Decreasing loss values indicate improving model
performance. In addition, the learning curves display Figure 3. Confusion matrices. (A) Confusion matrix for the validation
training and validation accuracy, offering a direct measure dataset, showing the distribution of true positives, true negatives, false
of the model’s classification capabilities on both seen and positives, and false negatives. The validation set was used during training
unseen data. Increasing accuracy values signify improved to monitor model performance and tune hyperparameters, achieving an
model performance. By analysing these learning curves, accuracy of 95.8%. (B) Confusion matrix for the test dataset, summarizing
the model’s predictions on unseen data held out during training. The test
the effectiveness of the training process and the model’s set accuracy of 94.5% demonstrates the model’s strong generalization to
capacity to generalize can be assessed. new data.
Volume 4 Issue 3 (2025) 88 doi: 10.36922/gtm.8526