
Page 97 - GTM-4-3
P. 97
Global Translational Medicine CNNs for overfitting and generalizability in fracture detection
dataset was partitioned into five folds (k = 5). The training
process was iterated five times, with each fold serving as
the validation set while the remaining four folds were
used for training. This approach ensured that the model’s
performance was assessed across different data subsets,
mitigating the potential impact of data distribution on the
evaluation metrics. The results of each fold’s validation
were then averaged to obtain a comprehensive measure
of the model’s performance. Ultimately, the accuracy
achieved through k-fold cross-validation was 95%.
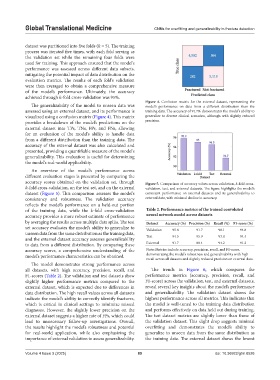
Figure 4. Confusion matrix for the external dataset, representing the
The generalizability of the model to unseen data was model’s performance on data from a different distribution than the
assessed using an external dataset, and its performance is training data. The accuracy of 91.7% demonstrates the model’s ability to
visualized using a confusion matrix (Figure 4). This matrix generalize to diverse clinical scenarios, although with slightly reduced
provides a breakdown of the model’s predictions on the precision.
external dataset into TPs, TNs, FPs, and FNs, allowing
for an evaluation of the model’s ability to handle data
from a different distribution than the training data. The
accuracy of the external dataset was also calculated and
presented, providing a quantifiable measure of the model’s
generalizability. This evaluation is useful for determining
the model’s real-world applicability.
An overview of the model’s performance across
different evaluation stages is presented by comparing the
accuracy scores obtained on the validation set, through Figure 5. Comparison of accuracy values across validation, k-fold cross-
k-fold cross-validation, on the test set, and on the external validation, test, and external datasets. The figure highlights the model’s
dataset (Figure 5). This comparison assesses the model’s consistent performance on internal datasets and its generalizability to
consistency and robustness. The validation accuracy external data, with minimal decline in accuracy.
reflects the model’s performance on a held-out portion
of the training data, while the k-fold cross-validation Table 2. Performance metrics of the trained convoluted
accuracy provides a more robust estimate of performance neural network model across datasets
by averaging the results across multiple data splits. The test Dataset Accuracy (%) Precision (%) Recall (%) F1‑score (%)
set accuracy evaluates the model’s ability to generalize to Validation 95.8 91.7 98.1 94.8
unseen data from the same distribution as the training data,
and the external dataset accuracy assesses generalizability Test 94.5 95.9 93.0 94.4
to data from a different distribution. By comparing these External 91.7 88.4 94.2 91.2
accuracy scores, a comprehensive understanding of the Note: Metrics include accuracy, precision, recall, and F1-score,
model’s performance characteristics can be obtained. demonstrating the model’s robustness and generalizability with high
recall across all datasets and slightly reduced precision on external data.
The model demonstrates strong performance across
all datasets, with high accuracy, precision, recall, and The trends in Figure 6, which compares the
F1-scores (Table 2). The validation and test datasets show performance metrics (accuracy, precision, recall, and
slightly higher performance metrics compared to the F1-score) across the validation, test, and external datasets,
external dataset, which is expected due to differences in reveal several key insights about the model’s performance
data distribution. The high recall values across all datasets and generalizability. The validation dataset shows the
indicate the model’s ability to correctly identify fractures, highest performance across all metrics. This indicates that
which is critical in clinical settings to minimize missed the model is well-tuned to the training data distribution
diagnoses. However, the slightly lower precision on the and performs effectively on data held out during training.
external dataset suggests a higher rate of FPs, which could The test dataset metrics are slightly lower than those of
lead to unnecessary follow-up investigations. Overall, the validation dataset. This slight drop suggests minimal
the results highlight the model’s robustness and potential overfitting and demonstrates the model’s ability to
for real-world application, while also emphasizing the generalize to unseen data from the same distribution as
importance of external validation to assess generalizability. the training data. The external dataset shows the lowest
Volume 4 Issue 3 (2025) 89 doi: 10.36922/gtm.8526