
Page 300 - IJB-9-4
P. 300
International Journal of Bioprinting Design and biomechanical analysis of porous tantalum prostheses
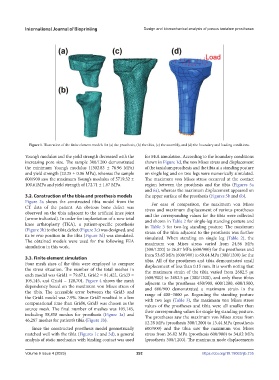
Figure 1. Illustration of the finite element models for (a) the prosthesis, (b) the tibia, (c) the assembly, and (d) the boundary and loading conditions.
Young’s modulus and the yield strength decreased with the for FEA simulation. According to the boundary conditions
increasing pore size. The sample 300/1200 demonstrated shown in Figure 1d, the von Mises stress and displacement
the minimum Young’s modulus (1302.83 ± 76.96 MPa) of the tantalum prosthesis and the tibia at a standing posture
and yield strength (23.25 ± 0.06 MPa), whereas the sample on single leg and on two legs were numerically simulated.
600/900 saw the maximum Young’s modulus of 5719.32 ± The maximum von Mises stress occurred at the contact
100.61MPa and yield strength of 172.71 ± 1.67 MPa. region between the prosthesis and the tibia (Figures 5a
and 6a), whereas the maximum displacement appeared on
3.2. Construction of the tibia and prosthesis models the upper surface of the prosthesis (Figures 5b and 6b).
Figure 3a shows the constructed tibia model from the For ease of comparison, the maximum von Mises
CT data of the patient. An obvious bone defect was stress and maximum displacement of various prostheses
observed on the tibia adjacent to the artificial knee joint and the corresponding values for the tibia were collected
(arrow indicated). In order for implantation of a new total and shown in Table 2 for single-leg standing posture and
knee arthroplasty (TKA), a patient-specific prosthesis in Table 3 for two-leg standing posture. The maximum
(Figure 3b) to the tibia defect (Figure 3c) was designed, and strain of the tibia adjacent to the prosthesis was further
its in vivo position in the tibia (Figure 3d) was simulated. simulated. When standing on single leg (Table 2), the
The obtained models were used for the following FEA maximum von Mises stress varied from 24.56 MPa
simulation in this work. (300/1200) to 26.87 MPa (600/900) for the prostheses and
from 53.65 MPa (600/900) to 69.64 MPa (300/1200) for the
3.3. Finite element simulation tibia. All of the prostheses and tibia demonstrated small
Four mesh sizes of the tibia were employed to compare displacement of less than 0.15 mm. It is worth noting that
the stress situation. The number of the total meshes in the maximum strain of the tibia varied from 2682.5 με
each model was Grid1 = 79,671, Grid2 = 81,422, Grid3 = (600/900) to 3482.5 με (300/1200), and only those tibias
105,145, and Grid4 = 128,701. Figure 4 shows the mesh adjacent to the prostheses 450/900, 600/1200, 600/1500,
dependency based on the maximum von Mises stress of and 600/900 demonstrated a maximum strain in the
the tibia. The accessible error between the Grid3 and range of 400–3000 με. Regarding the standing posture
the Grid4 model was 7.9%. Since Grid3 resulted in a less with two legs (Table 3), the maximum von Mises stress
computational time than Grid4, Grid3 was chosen as the values of the prostheses and tibia were all smaller than
source mesh. The final number of meshes was 105,145, their corresponding values for single-leg standing posture.
including 58,858 meshes for prosthesis (Figure 1a) and The prostheses saw the maximum von Mises stress from
46,287 meshes for patient’s tibia (Figure 1b). 12.28 MPa (prosthesis 300/1200) to 13.44 MPa (prosthesis
Since the constructed prosthesis model geometrically 600/900) and the tibia saw the maximum von Mises
matched well with the tibia (Figures 1c and 3d), a general stress from 26.82 MPa (prosthesis 600/900) to 34.82 MPa
analysis of static mechanics with binding contact was used (prosthesis 300/1200). The maximum node displacements
Volume 9 Issue 4 (2023) 292 https://doi.org/10.18063/ijb.735