
Page 448 - IJB-9-5
P. 448
International Journal of Bioprinting Core-shell bioarchitectures
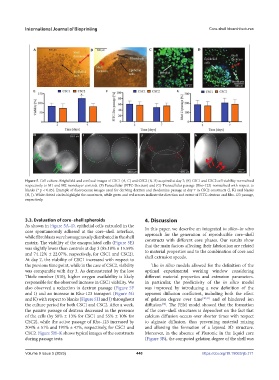
Figure 5. Cell culture. Brightfield and confocal images of CSC1 (A, C) and CSC2 (B, D) acquired at day 7; (E) CSC1 and CSC2 cell viability normalized
respectively to M1 and M2 monolayer controls. (F) Paracellular (FITC-Dextran) and (G) Transcellular passage (Rho-123) normalized with respect to
blanks (* p < 0.05). Example of fluorescence images used for deriving dextran and rhodamine passage at day 7 in CSC2 constructs (I, K) and blanks
(H, J). White dotted circles highlight the constructs, while green and red arrows indicate the direction and extent of FITC-dextran and Rho-123 passage,
respectively.
3.3. Evaluation of core–shell spheroids 4. Discussion
As shown in Figure 5A–D, epithelial cells extruded in the
core spontaneously adhered at the core–shell interface, In this paper, we describe an integrated in silico–in vitro
while fibroblasts were homogenously distributed in the shell approach for the generation of reproducible core–shell
matrix. The viability of the encapsulated cells (Figure 5E) constructs with different core phases. Our results show
was slightly lower than controls at day 3 (85.18% ± 15.59% that the main factors affecting their fabrication are related
and 74.12% ± 22.07%, respectively, for CSC1 and CSC2). to material properties and to the combination of core and
At day 7, the viability of CSC1 increased with respect to shell extrusion speeds.
the previous time point, while in the case of CSC2, viability The in silico models allowed for the definition of the
was comparable with day 3. As demonstrated by the low optimal experimental working window considering
Thiele number (S10), higher oxygen availability is likely different material properties and extrusion parameters.
responsible for the observed increase in CSC1 viability. We In particular, the predictivity of the in silico model
also observed a reduction in dextran passage (Figure 5F was improved by introducing a new definition of the
and I) and an increase in Rho-123 transport (Figure 5G apparent diffusion coefficient, including both the effect
and K) with respect to blanks (Figure 5H and J) throughout of gelation degree over time [30,31] and of hindered ion
the culture period for both CSC1 and CSC2. After a week, diffusion . The FEM model showed that the formation
[32]
the passive passage of dextran decreased in the presence of the core–shell structures is dependent on the fact that
of the cells (by 50% ± 13% for CSC1 and 55% ± 10% for calcium diffusion occurs over shorter times with respect
CSC2), while the active passage of Rho-123 increased by to alginate diffusion, thus preventing material mixing
204% ± 51% and 191% ± 47%, respectively, for CSC1 and and allowing the formation of a layered 3D structure.
CSC2. Figure 5H–K shows typical images of the constructs Moreover, in the absence of Pluronic in the liquid core
during passage tests. (Figure 3B), the computed gelation degree of the shell was
Volume 9 Issue 5 (2023) 440 https://doi.org/10.18063/ijb.771